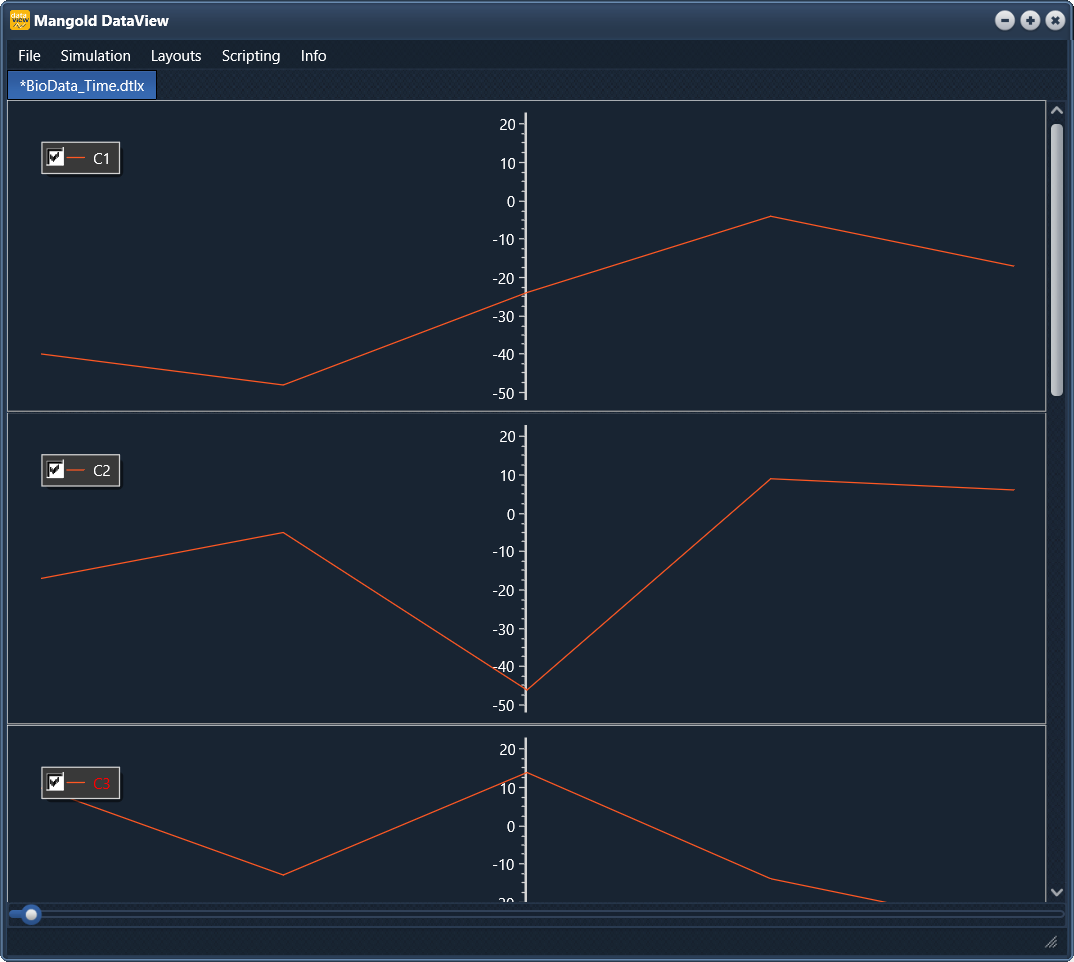
After import, all data is displayed in a single chart per channel on the 'Default layout', like this:

All charts are listed vertically.
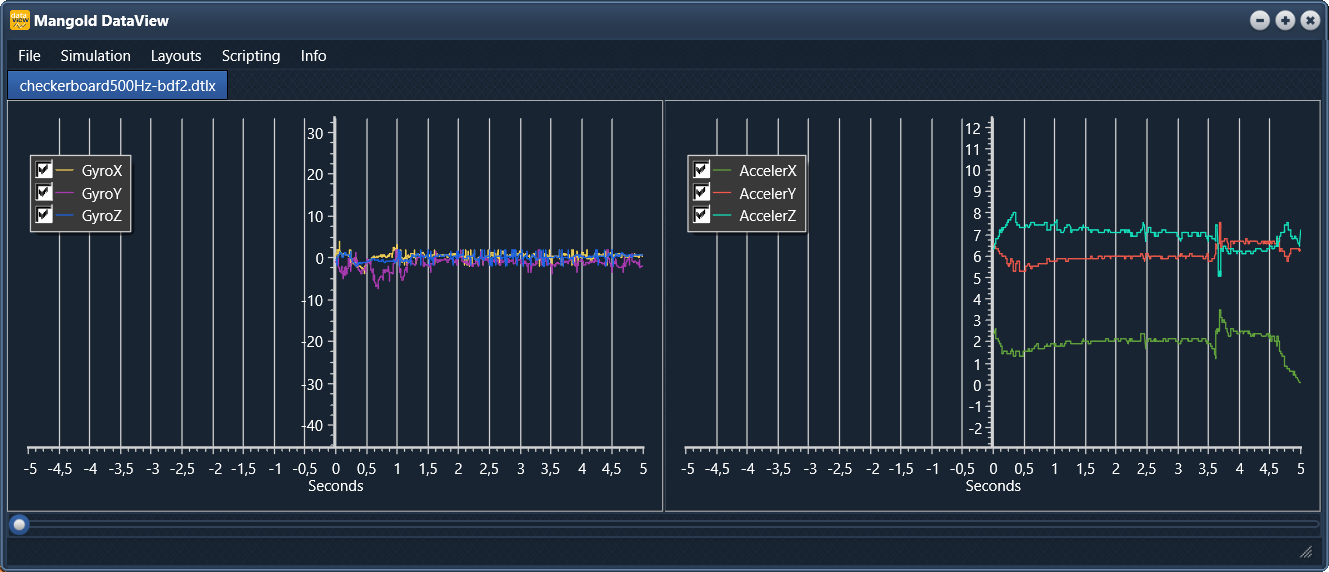
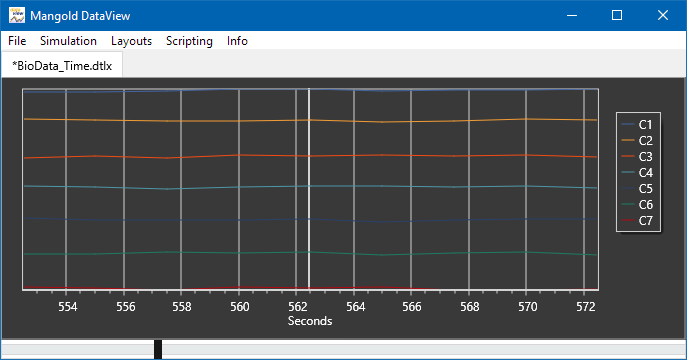
For a more compact view, you can adapt this layout or create new Layouts and bundle multiple channels into a single chart.
For example like this:

Or like this:

Or even just like this:

Select current Layout
Once you have created or imported multiple layouts, you can select the current view on your data like this:
▪Select Layouts - <Your Layout Name> from the menu, to switch between layouts.
Per default, there is only one Default Layout available. How to create, adapt and adopt layouts is explained in User Defined Layouts.
Structured Values
You can organize your values in multiple layouts, making sure you can see just those values you are currently interested in.
▪Read User Define Layouts for details.