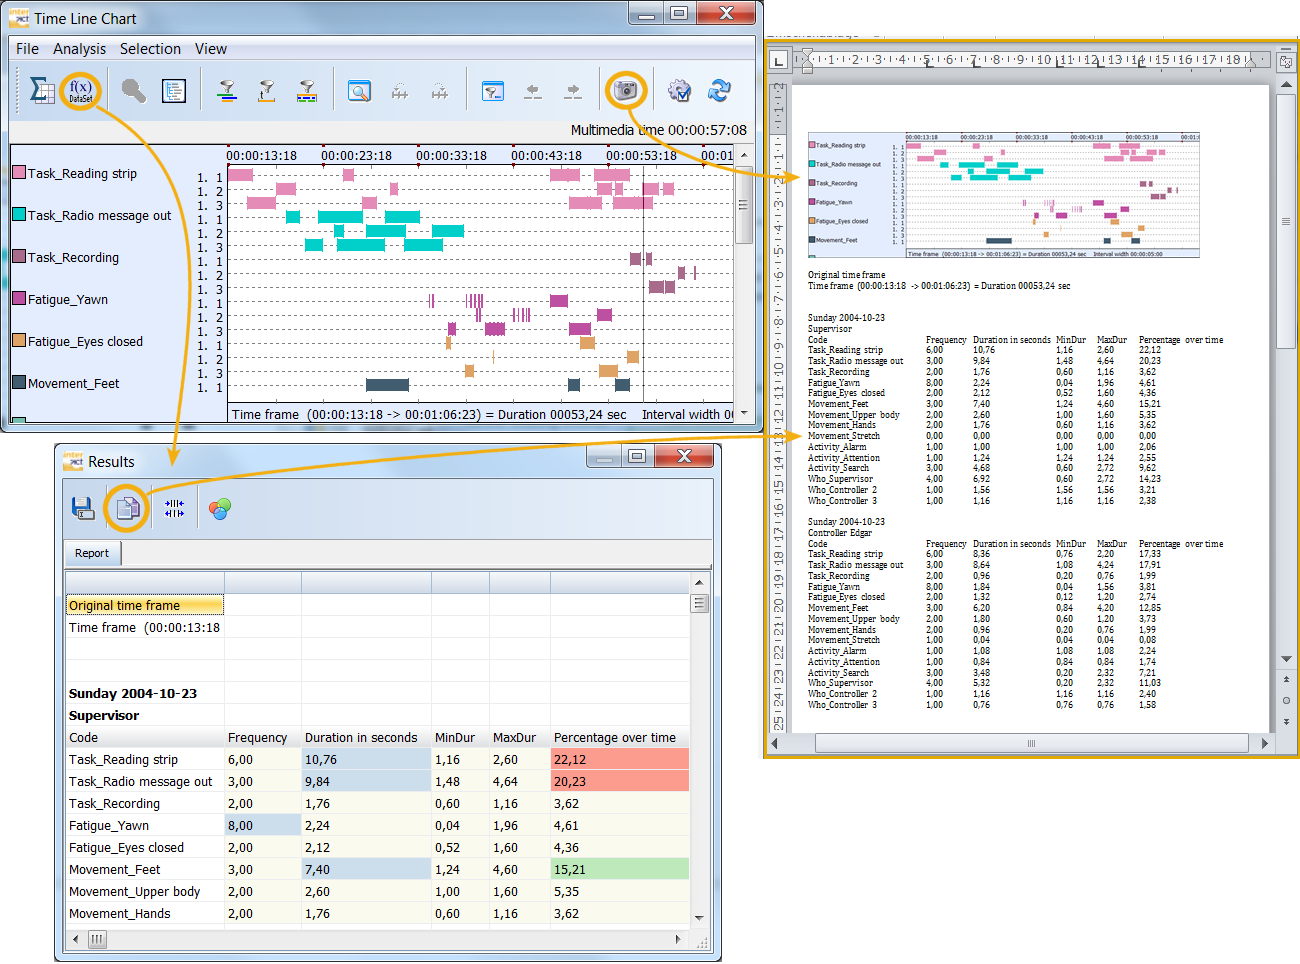
If you combine the functionality of the Time Line Chart, the standard copy and past functions of Windows and an office program like Word or Excel, you can create a report with about 4 mouse clicks!
▪Create a Time Line Chart with the data you need in your report.
▪Click on the ![]() icon in the Time Line Chart window to make a screen shot of this graph.
icon in the Time Line Chart window to make a screen shot of this graph.
▪Create a new word document (or open an existing one).
▪Click in the target document and choose Edit - paste from the menu or use the standard shortcut CTRL+V.
▪Choose Analysis - Statistics per DataSet ![]() (or Analysis - Full statistics
(or Analysis - Full statistics ![]() ), from the menu within the Time Line Chart window or click on the corresponding buttons.
), from the menu within the Time Line Chart window or click on the corresponding buttons.
▪Click on the Copy button![]() in the 'Results' window.
in the 'Results' window.
▪Click in your target document and choose Edit - paste from the menu or use the default shortcut CTRL+V.
Note: All values are inserted as tab separated text. This means that in Word you need to adjust the tab stops to make it all fit.
•