To get the statistics on what happens during the Pre- and Post-Events (in this example during the 30 seconds before each 'Imitative' period), proceed as follows:
▪Click Analysis - Evaluation - Timeline Chart ![]() and select the Codes you are interested in.
and select the Codes you are interested in.
▪In the Timeline Chart window, click the Trim on code filter ![]() .
.
▪Select the Class that holds your Pre-Events ('Pre-Period' in this case) and the new 'Pre' Code ('Pre_Imitative' in this case) in the upcoming dialog.
▪Confirm with OK.
▪Now all Events outside the selected periods are removed from the Timeline Chart:
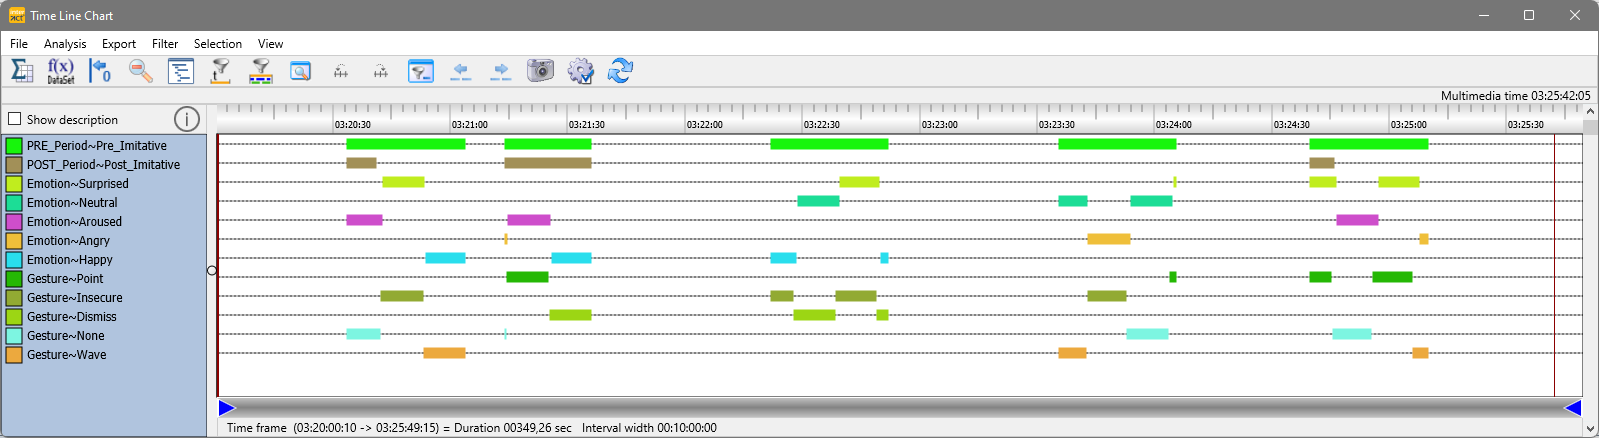
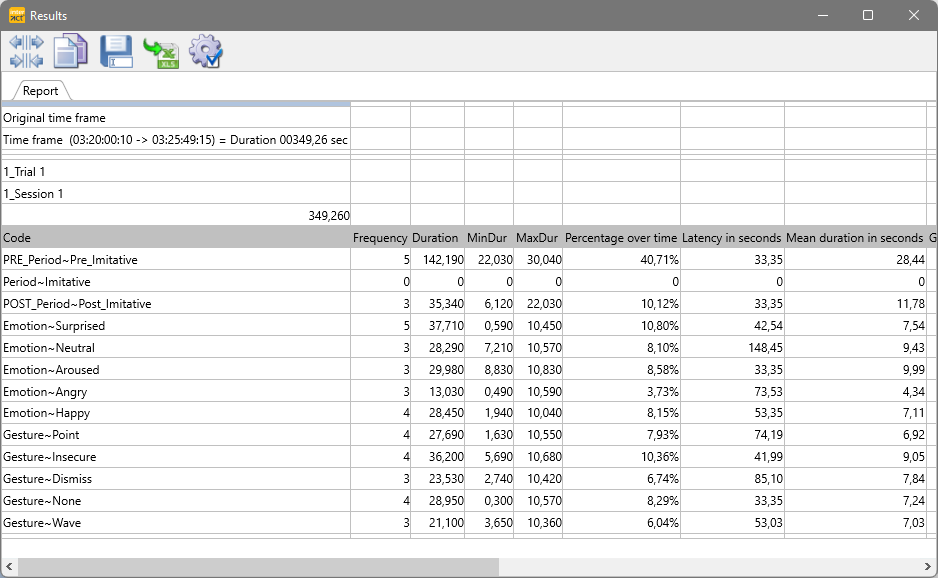
This means, that the statistics now only reflect the data currently visible, giving you the details you are looking for:
To get the details on the 'Post Imitative' periods:
▪Click on the Reload  icon reload all Events again.
▪Repeat all steps to the 'Post-...' Code.