The colors as used in various statistical result tables for a visual data exploration can be changed here.
INTERACT offers a special visual data exploration routine, which is active per default:
▪The icon Visual Data Exploration ![]() in the toolbar, allows you (de)activate this functionality.
in the toolbar, allows you (de)activate this functionality.
All results are analyzed and colored in 25% bins, like this:
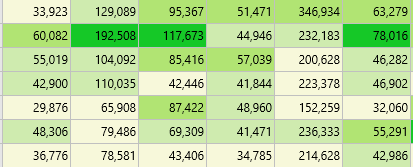
For this, all values are compared per column, and the range, between the lowest and highest value, is used to split the results into four groups:
•Color 1 is used for the values within the lowest 25%
•Color 2 is used for the values within the next 25%
•Color 3 is used for the values within the third 25%
•Color 4 is used for the values within the highest 25%
This gives you immediate visual feedback on your results.
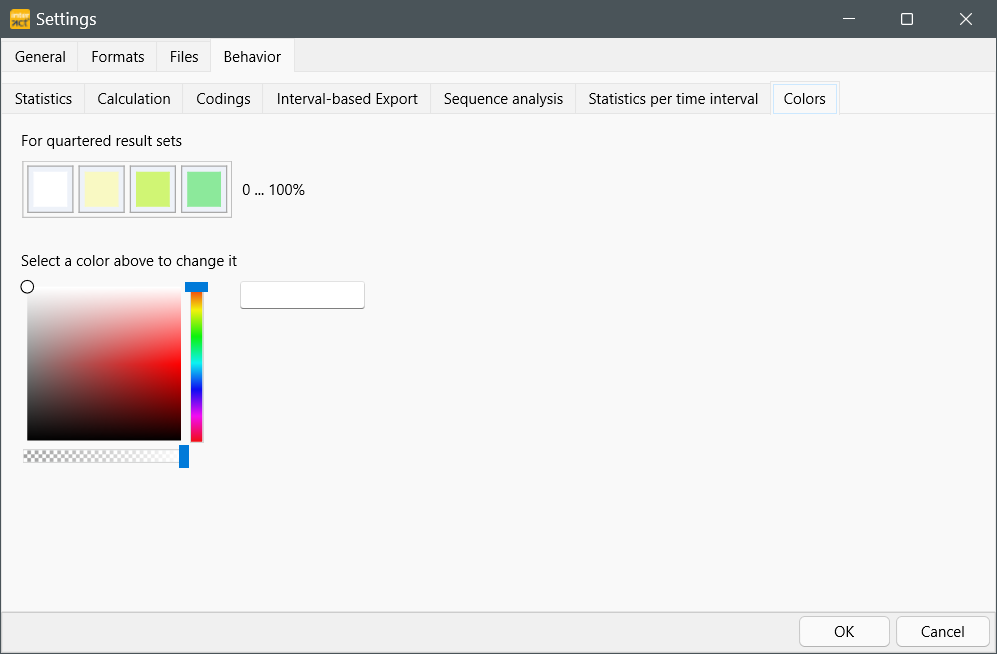
Specify Colors
You can specify the colors for quartered result sets in the application settings:
▪Select General - Program - Settings ![]() and switch to the tab Behavior - Colors.
and switch to the tab Behavior - Colors.
▪Change the colors For quartered result sets to your liking: