IMPORTANT: This routine analyzes interval-by-interval, providing interval-based statistics on event-based data.
This report provides you with descriptive statistical results per time-interval.
▪Select Analysis - Evaluation - Statistics ![]() > Statistics per Time-Interval
> Statistics per Time-Interval
OR
▪Select Analysis - Statistics per Time-Interval from the menu within the Timeline Chart.
▪Select the value-type you are interested is from the Statistical values to show list:
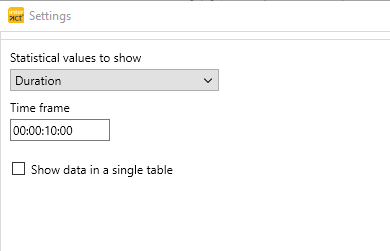
▪Enter the required interval width in the Time frame field.
The option Show data in a single table specifies how your output is structured:
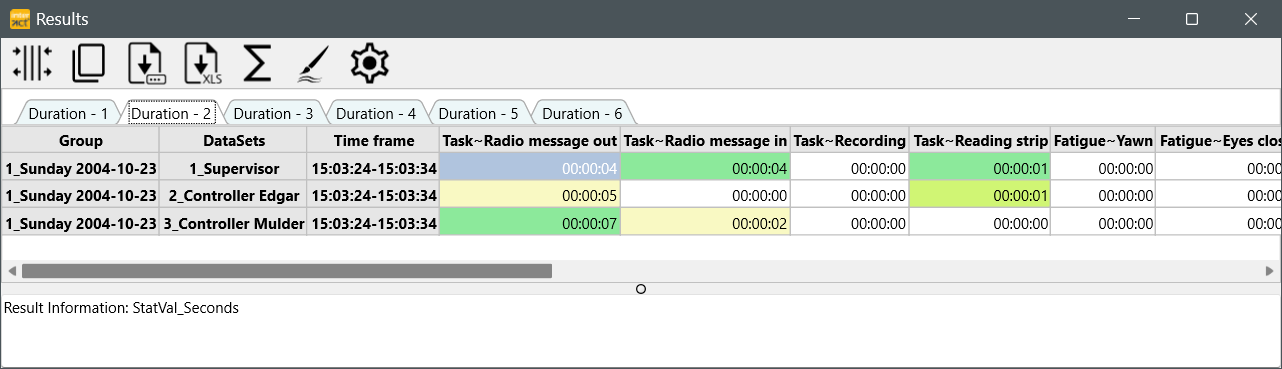
| Separate Table per Interval - Generates as many table-tabs as intervals do fit in the total session length: |
▪Clear the option Show data in a single table to receive a separate table per interval.
A dialog showing your the number of resulting tables

▪Confirm the dialog with Yes to receive results in a separate table per interval:
▪Click the Export to XLS icon to export all data into an Excel file with the same number of tabs.
▪To save the content of a particular interval, click the Copy or Save as button.
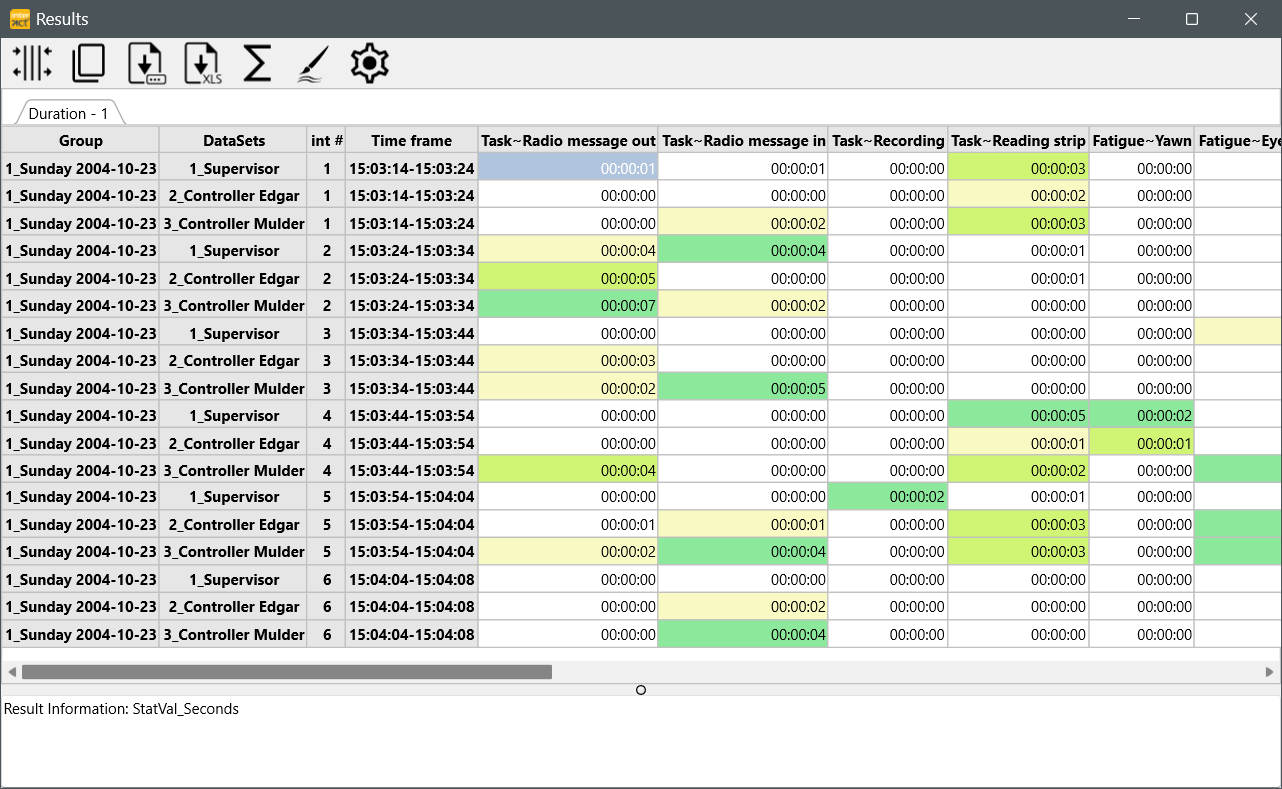
| All Intervals on a single sheet - Adds all intervals subsequently, using an Int# to easily tell them apart. |
▪Select the option Show data in a single table to combine the results for all intervals in a single table.
The results are combined in a single table like this:
As usual, the Result table holds the following commands:
oSummary command to summarized the values over all displayed Sets.
oCommands to Save and Copy the results as shown.
oExport command to create an Excel file from the shown results.
oSettings to alter the time format displayed in the results.