You can access most statistics in two different ways:
oDirectly on the Analysis tab (Analysis - Evaluation - Statistics ![]() ) - All data for the selected Codes and Classes is analyzed.
) - All data for the selected Codes and Classes is analyzed.
oFrom within the Timeline Chart window - Allows you to limit the analysis to a specific time frame.
The big difference is that the direct method is automatically applied to all selected Codes and DataSets as a whole. The routines available from within the Timeline Chart can be limited to a specific time frame or after a filter is used to virtually remove part of your Codes.
IMPORTANT: The statistics, exports and analysis routines available within the Timeline Chart, always reflect the data currently visible in the Timeline Chart.
If e.g. you are ‘zoomed-in' on just a part of your data, only this part is taken into account in the statistics results.
Statistics per Code - The command Analysis - Statistics per Code provides you with a table with the accumulated values per Code/Class combination in separate columns: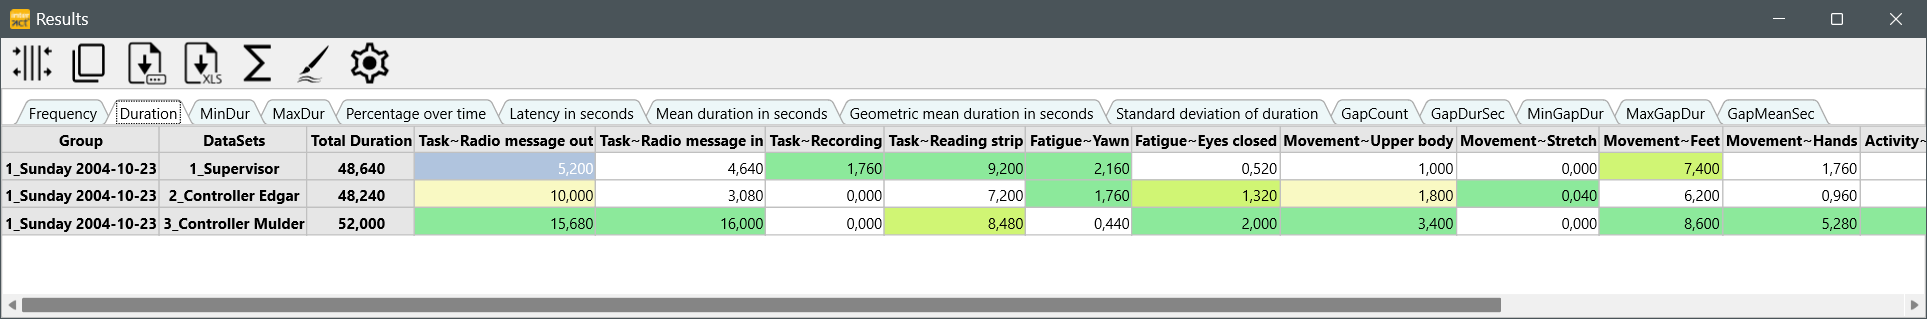 |
Statistics per Class - The command Analysis - Statistics per Class provides you with a table holding the accumulated values per Class, per column: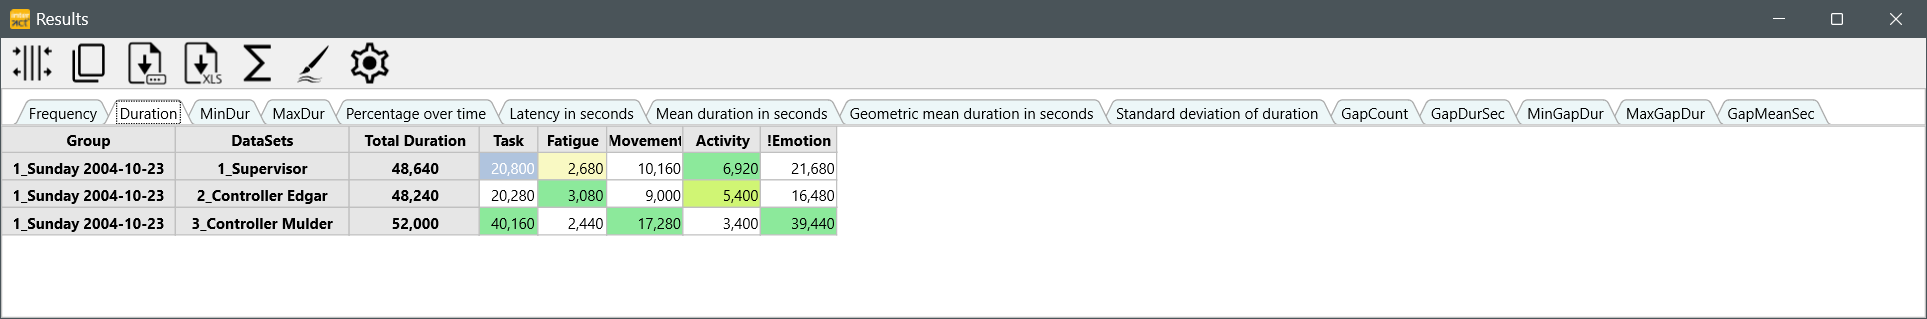 |
Statistics on DataSets - The command Analysis - Statistics per DataSet provides you with a table in which all available statistics are listed simultaneously. the data is grouped per DataSet and lists all all available Codes with their corresponding values in one line: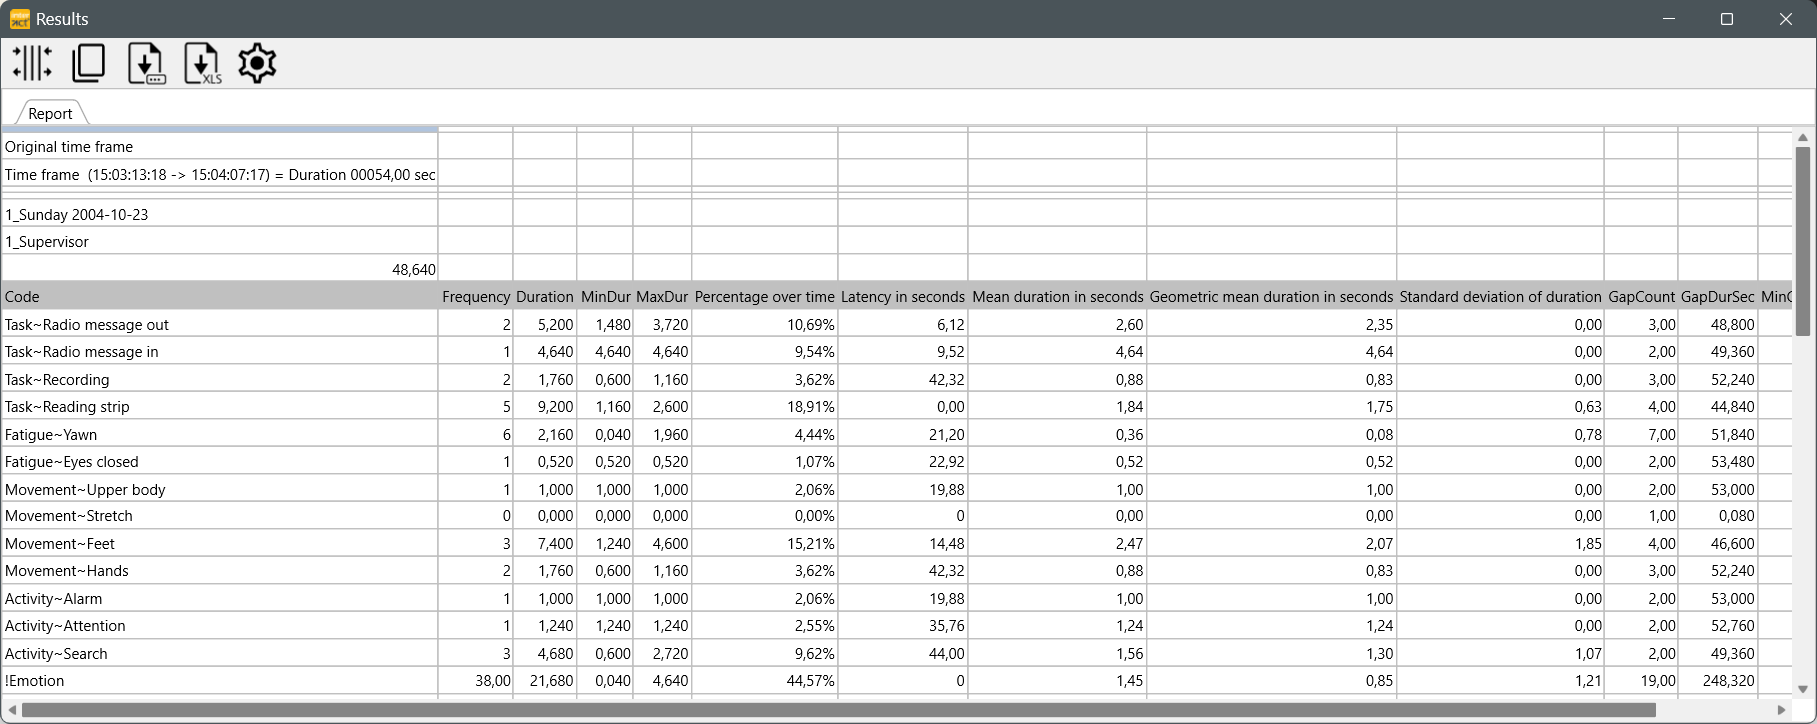 |
Statistics per Time-interval - The command Analysis - Statistics per time interval provides you with a table in which the data is split into any given interval width, showing only the results for the selected value type: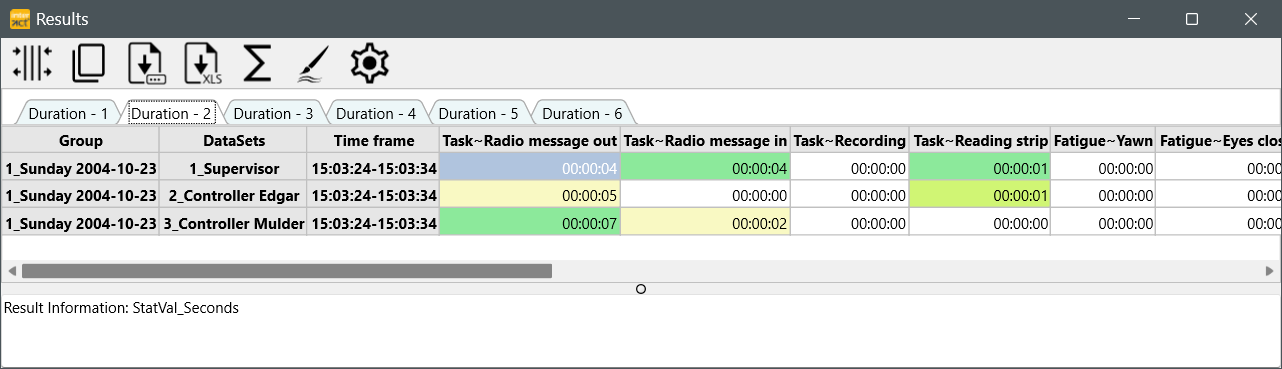 |
Order of Appearance - The command Analysis - Order of Code Appearance provides you with a list in which per Set the time value of the first occurrence for each Code is listed: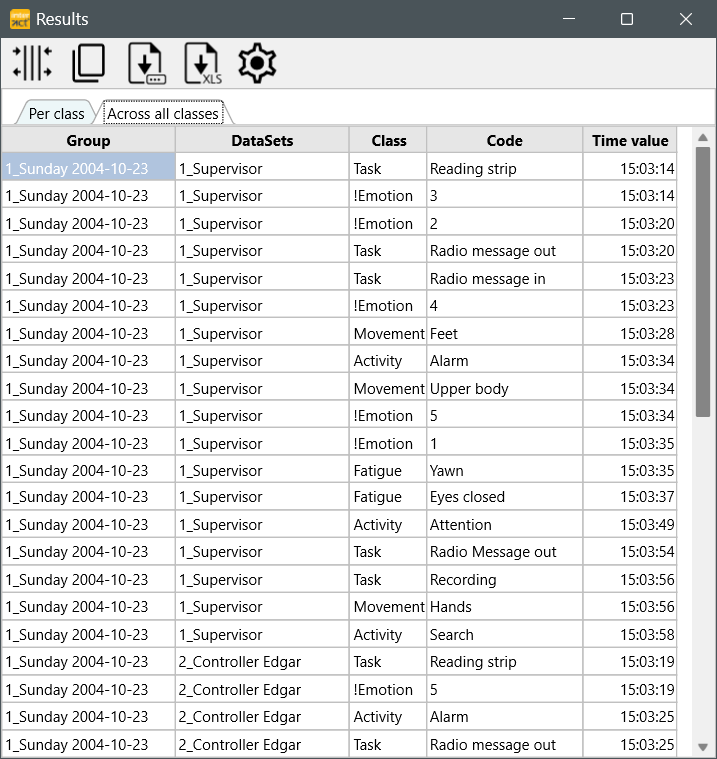 |
Code-based Interval Statistics - The command Analysis - Code-based Interval Statistics provides you with a list of lines representing variable-length intervals, depending on the selected Code based on which the intervals are created.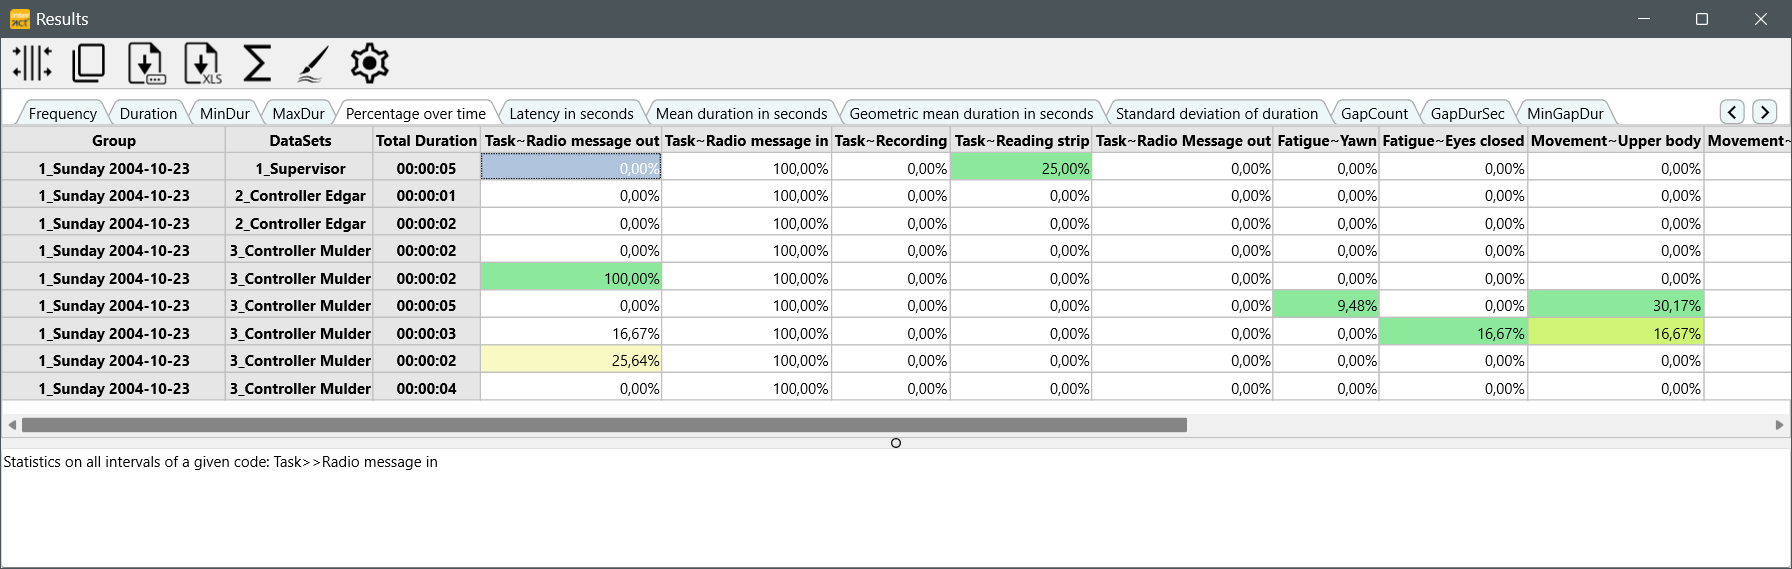 |