You can influence how your Codes bars are displayed in the Time Line Chart window right here:
▪Click Time Line Chart Settings ![]() .
.
▪Switch to the Visualization tab.
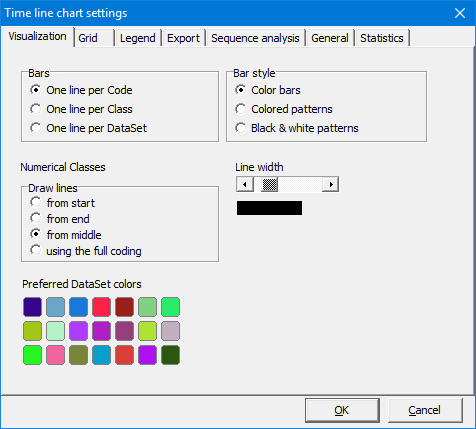
Observation Codes
Bar lines
•One line per Code - Displays Codes and Classes with a single line for each Code separately. The Classes combined with the occurring Observation Codes are listed on the left side of the graphic. The Observation Codes are split by DataSet, the DataSet number is listed in front of each row.
•One line per Class - Cumulates all Codes per Class into one line. The Classes of the document are shown on the left side of the graph. Every Code has its own color. This presentation is only useful when working with mutual excluding Codes per Class,
•One line per DataSet - Shows all Codes and Classes in a single line per DataSet. Only the DataSet numbers are listed on the left side of the graph. Every Class_Code combination has its own color (good for mutual exclusive Codes per DataSet).
Bar pattern
•No Patterns - Display each Code as a solid bar, using the color stored in the Code Archive.
•Colored patterns - Display each Code bar, using both the color and the pattern stored in the Code Archive.
•Black & While patterns - Display each Code bar, using only the pattern stored in the Code Archive.
| TIP: | Click Code Archive |
Line width
Use the Line width slider to change the strength of the Code bars.
| TIP: | To change the line width accurately, click on the scroll bar and use the ARROW RIGHT and ARROW LEFT keys on your keyboard! |
Numeric Classes
If you use any numeric and/or numeral !Classes, the Time Line Chart displays them as a diagram (line chart). If those Codes are recorded with duration, you need to decide at what point of time the Code is drawn. Standard the lines are drawn from the middle of the duration of each Code.
•Draw lines...from start - Draws the graph lines from the start time of one Event to the start time of the next Event.
•Draw lines...from end - Draws the graph lines from the end time of one Event to end time of the next Event.
•Draw lines...from middle - Draws the graph lines from and to the center of successive Events. This is the default and recommended setting.
•Using the full coding - The diagram is drawn, following the complete length of each Event, resulting in a stair wise graph.