After starting the Cohen's Kappa analysis and defining the parameters, INTERACT starts comparing the files. This basically means: trying to find matching pairs, based on the parameters you applied in the first dialog.
A detailed overview of how INTERACT applies your rules can be found in Kappa Pair Finding Routine.
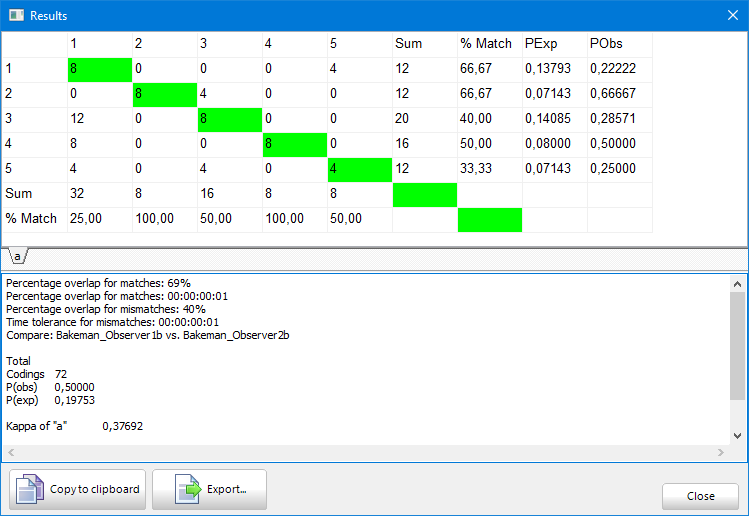
In the Results matrix, the sum of all found "pairs" is written into the green fields, building a diagonal line.
The results of the analysis are displayed in the Results dialog:
The information in the Kappa results dialog can be read as follows:
oEach class is displayed in a separate tab.
oThe matrix gives you an overview of the found pairs as well as an on how often the Codes did not match.
oAll entries in the diagonal green fields are the matching pairs found.
o% Match shows the percentage of agreement per Code.
oP(exp) lists the proportion of agreement expected by chance per Code.
oP(obs) lists the proportion of agreement actually observed.
oIf the observers did detect different behavior in the same time frame, their dissimilar codes are displayed in the other (white) fields:
In columns you find the observations from the 'master' file (the file currently selected - Bakeman_Observer2.xiact in this case), corresponding to the Codes in the column headers.
In rows the results of the second file (Bakeman_Observer1.xiact in this case) are listed.
In the lower part of the Results window you can find:
oThe exact file names of the compared data-files are listed, as well as the parameter used to get those results.
oThe total number of codings (Events) and the overall P(observed) and P(expected), which results in the Kappa value for the current Class.
The order of selection can influence the calculation of the Kappa coefficient!
Note: You can change the order of the selected documents in the Kappa Graph dialog.
Percentage of agreement per Code
In addition to the Kappa value, INTERACT offers a percentage of agreement per Code. This has been implemented for all those that cannot rely on the Kappa value, due to their coding system (less than 3 Codes per Class, very little Events etc.).
Independent of probability, the value in the green field (number of pairs found) is divided by the summary of its row as well as the summary of its column. Depending from what angle you look at the data.
This means, that for the first set of results, the number of found pairs is divided by the sum of the corresponding column (e.g. for Code '1' : 8 / 32 *100 = 25,00% ), whereas in the second set of results are based on the number of found pairs, divided by the sum of each line (e.g. for code '1' : 8 / 12 * 100 = 66,67 %).
This results in a percentage of identical codings per Code, enabling you to compare the results e.g. of the trainer with that of the students.
Note: The results largely depend on the specified Parameters. A detailed description of those parameters can be found in Kappa parameters.
Export results
▪Click the Copy ![]() icon to get the results for ALL Classes into the Windows clipboard.
icon to get the results for ALL Classes into the Windows clipboard.
▪Paste those results into your favorite target application (e.g. Notepad, Excel, Word,...).
Adjust Parameters
If the results to not match your expectations, adjustmenting the initial parameters might improve the situation. You can return to the Kappa Parameters dialog from within the Kappa Graph dialog:
▪Click Define parameter to return to the Kappa Parameters dialog.
Visualize pairs
To enable you to actually see what INTERACT did count as correct pairs, we implemented a special graph module that shows you exactly what has been found.
▪Read Kappa Graph for details on the visual feedback system.