Each layout has a variation of properties you can specify:
▪Click the little gear ![]() icon behind the layout name
icon behind the layout name
or
▪Select Layout - Layout Settings within the layout editor window.
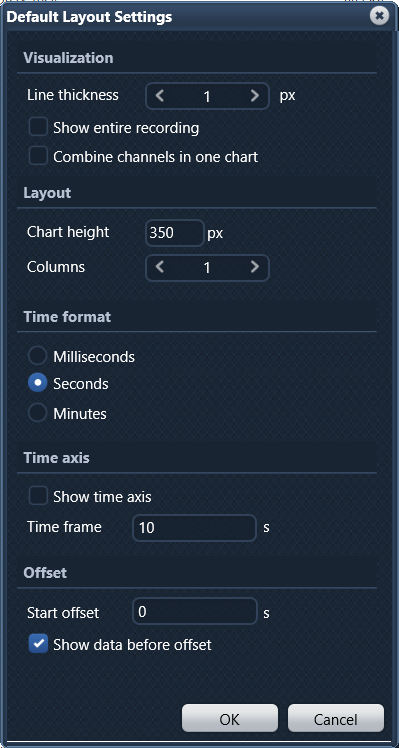
The layout settings dialog dialog like this opens:
Visualization
You can increase the thickness of the lines drawn in your charts:
▪Increase the number of pixels in the Line thickness value box.
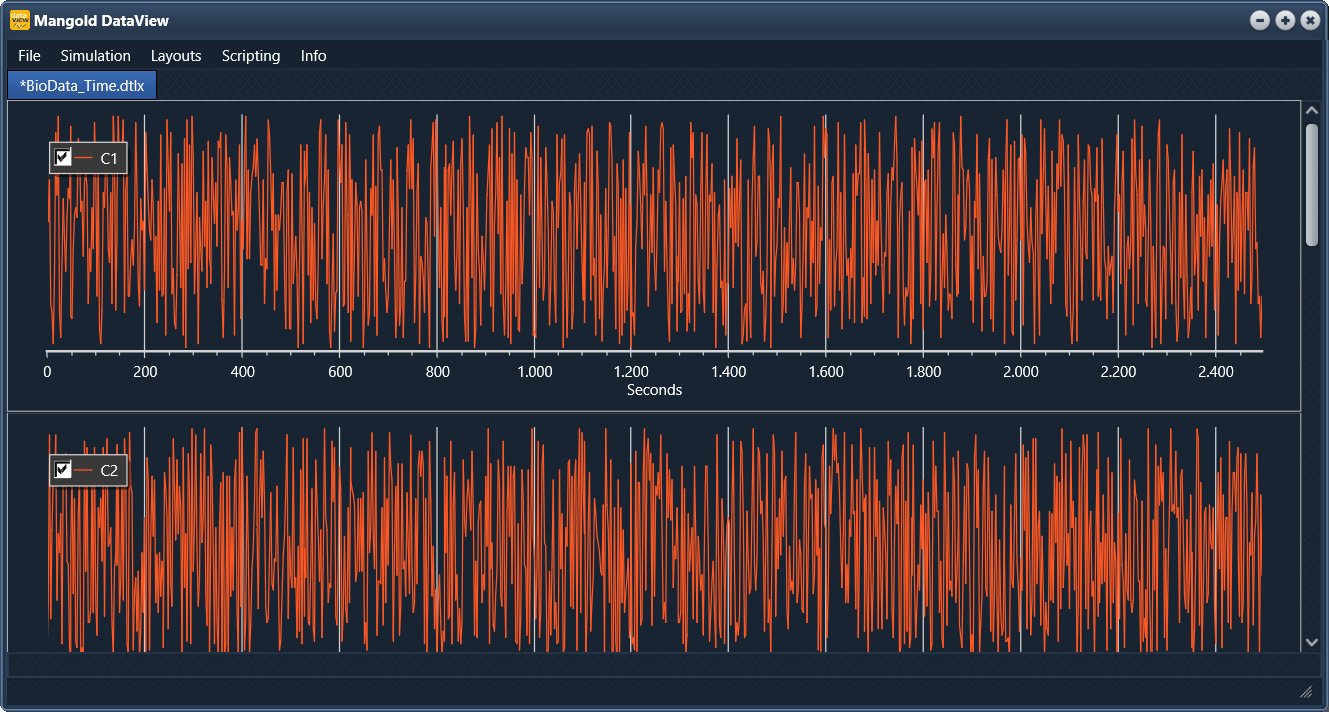
To display all values of a complete session inside a single chart:
▪Select Show entire recording.
To combine all channels into a single chart:
▪Select Combine channel in one chart.
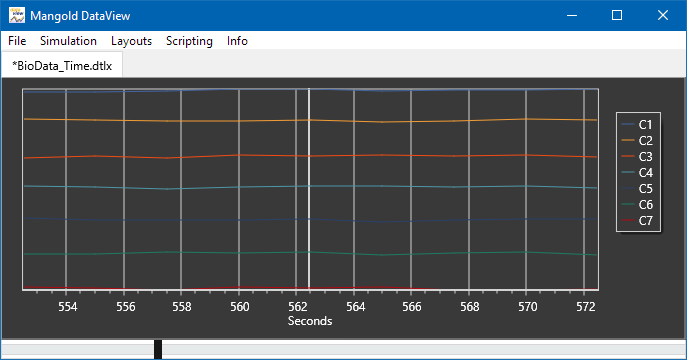
IMPORTANT: This option results in a totally different chart than adding all channels to a single chart manually. This option creates a chart in which all values are spread equally divided over the x-axis and does NOT show any measured value scale.
Layout
▪Specify the default height of your charts by increasing or decreasing the value in the Chart height box.
▪Select the number of columns in which you'd like your charts to appear:
Time Format
To change the time format for the displayed time values:
▪Select the format you prefer, depending on the required details.
Note: Changing the time format automatically change the Time frame value in the value box!
(for instance 1 second changes to 1000 milliseconds)
Time axis
Per default the time axis is invisible. To show the time axis:
▪Select Show time axis
The horizontal time frame, covered by the chart, can be specified to your needs:
▪Enter the time frame you want to visualize into the Time frame field.
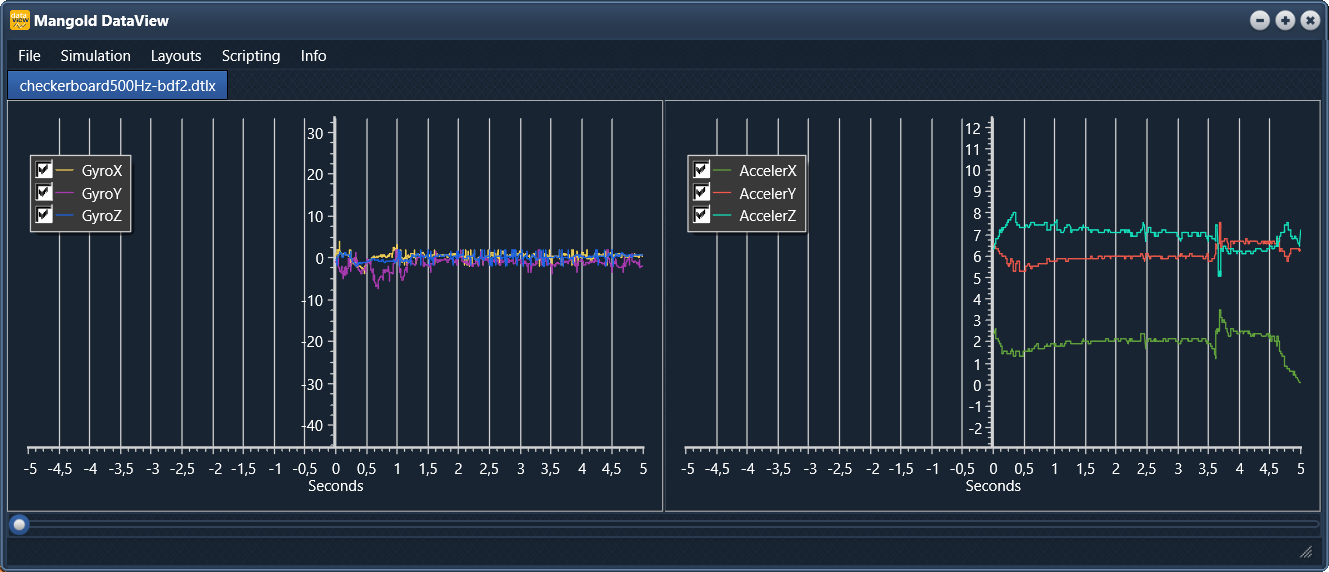
Note: The total time frame is split in the middle by the middle axis. This means to look 10 seconds 'into the future' (time shown on the right side of the middle axis), you'll need to specify a time frame of 20 seconds.
Offset
If you imported data lines that were recorded before the video started, you can tell DataView to skip this data for synchronization purposes. To manipulate the start point of your sensor data, to synchronize it with a specific frame in the video:
▪Enter the required offset into the Start offset field.
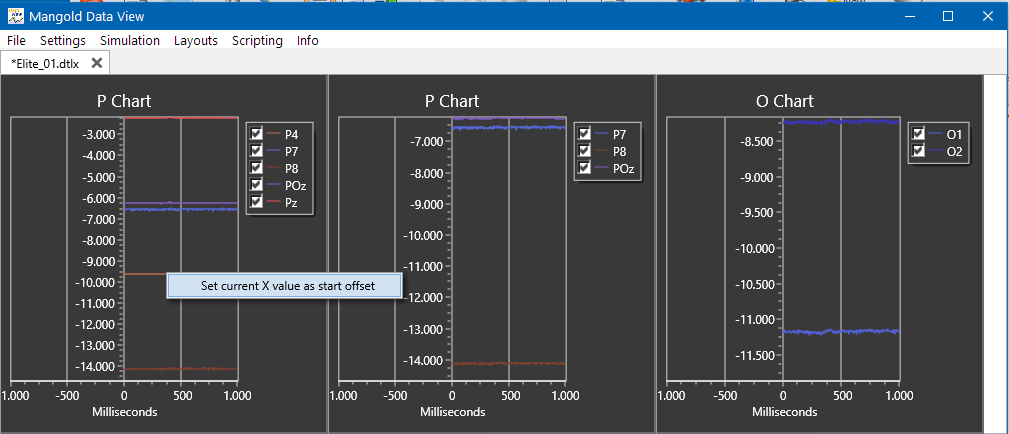
| TIP: | If there is a peak or other significant value visible in your chart that identifies the start of the video, you can enter this value from within the chart itself, by making a |
CTRL + RIGHT CLICK into the chart at the required position and pick Set current X value as start offset.
