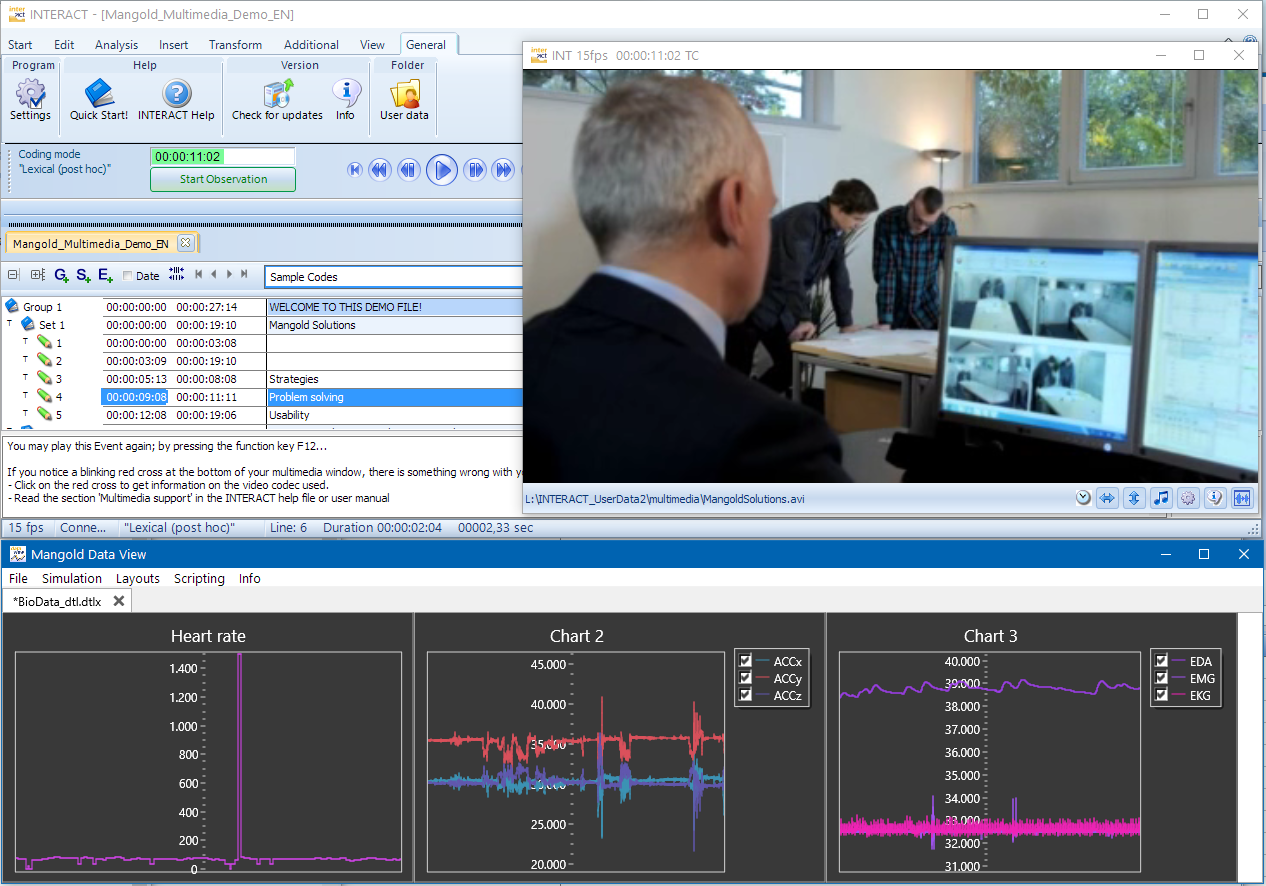
DataView automatically hooks up with INTERACT.
This means, that from the moment you've imported the external sensor data and selected the values to be shown, you can play your video within INTERACT and watch the corresponding charts simultaneously!
(A second monitor might come in handy though.)
▪Make sure the DataView window is visible next to your INTERACT window(s).
▪Resize and move your windows to position both DataView and INTERACT in a visible way, like shown in the picture.
(For INTERACT only the Observation ribbon and the Multimedia-Window(s) are important now.)

You can now control the graphs both from within INTERACT and DataView.
Note: To make use of the combination DataView and Mangold Vision, you will need to assign your data file to the corresponding participant first, as is described in
| INTERACT |
▪Double click on a time code within your INTERACT data to position video and sensor data.
▪Start the video with INTERACT, using the Play ![]() button in the Observation Controls.
button in the Observation Controls.
As soon as the video starts playing, you see the charts moving within the DataView window, all in sync with the video that is controlled by INTERACT.
(If you picked the right synchronization point of course)
| DataView |
Simulation
▪Select Simulation - Start Simulation to start a simulated run of your charts.
▪Select Simulation - Stop Simulation to stop the simulated run .
To return to the start of your data:
▪Select Simulation - Back to beginning from the menu.
Value-based
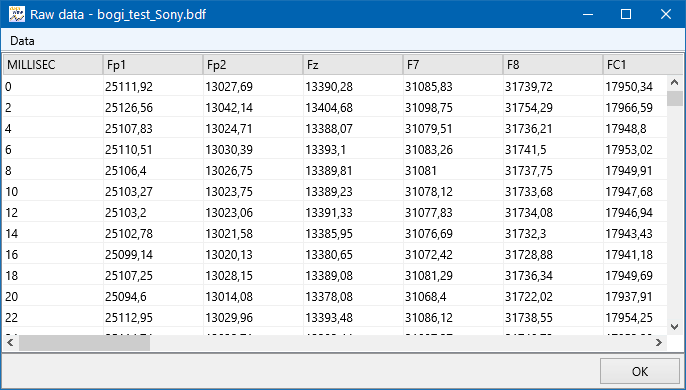
▪Choose File - Show Raw data... from the menu.
▪A separate window appears:

▪Click on a line with a specific value to position the graph at that point in time.