Apart from the DataSet oriented statistics, available in the Timeline Chart, as is described in DataSet-based Statistics, INTERACT also offers accumulated view for the selected Codes from a single Class, for all selected DataSets.
The main differences to the Descriptive DataSet-based Statistics are:
ovalues accumulated per Code over all selected DataSets
oPercentages per Code within a single Class
oDifferentiation between coded and not coded events per Class
Available Visualizations
oFrequency of Occurrence - Class-based Pie-chart view with the pattern of distribution of the Codes for the selected Class, based on the frequency of the Codes within that Class.
oDuration Pie-Chart - Class-based Pie-chart view with the pattern of distribution of the Codes for the selected Class, based on the duration of the Codes within that Class.
Coded versus not Coded
When logging data with INTERACT your data may contain only a single Code per Event. If your coding system has multiple classes, this results in many empty 'cells' in your data because per line only one 'cell' is filled with a Code.
Depending on the logic behind your coding system, analyzing the relation between filled and empty cells might be useful or not.
If you pie-charts shows an area that is labeled "Not coded", the empty cells are part of the calculation:
This area, represents all Events of the selected DataSets, that do NOT contain a Code for the selected Class.
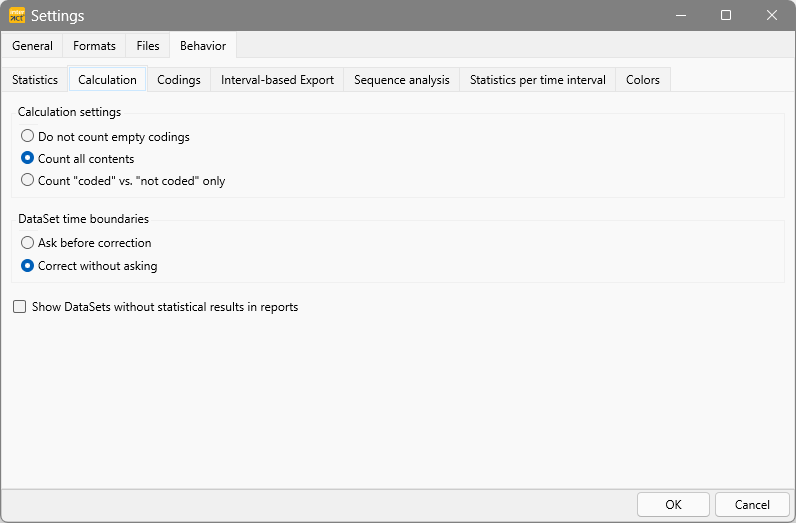
Depending on your personal preferences or the requirements for your study, you can select different calculation options in the General - Program - Settings ![]() on the tab Behavior - Calculation.
on the tab Behavior - Calculation.
In this dialog you can adjust the calculation settings to your needs:
Note: You can even create a graph of only coded versus not coded data.
•For further details, read the topic Calculation settings.