IMPORTANT: This function requires a working Python installation. All required modules come with the installation of INTERACT per default.
In case of an error message, read the topic Python integration to learn how to fix this.
This is how you create a pie chart showing the distribution pattern of the duration or frequencies of the selected Codes within a Class:
•Click Analysis - Advanced - Visualization ![]() > Pie Chart for Code duration and Frequencies in the toolbar.
> Pie Chart for Code duration and Frequencies in the toolbar.
•Choose one Class from the now appearing Filter dialog.
If you select several classes, all values of the selected classes will be accumulated, and the sum of all values will be considered as 100%.
•If your data file contains more than one DataSet, select the required DataSet(s) from the Select DataSet dialog.
Note: If you select multiple DataSets, all values from the selected DataSets are accumulated.
The resulting Pie-Chart is displayed in a new tab or your default internet browser.
Using the Multi-purpose analysis demo file for Set 1 only, the resulting chart looks like this:
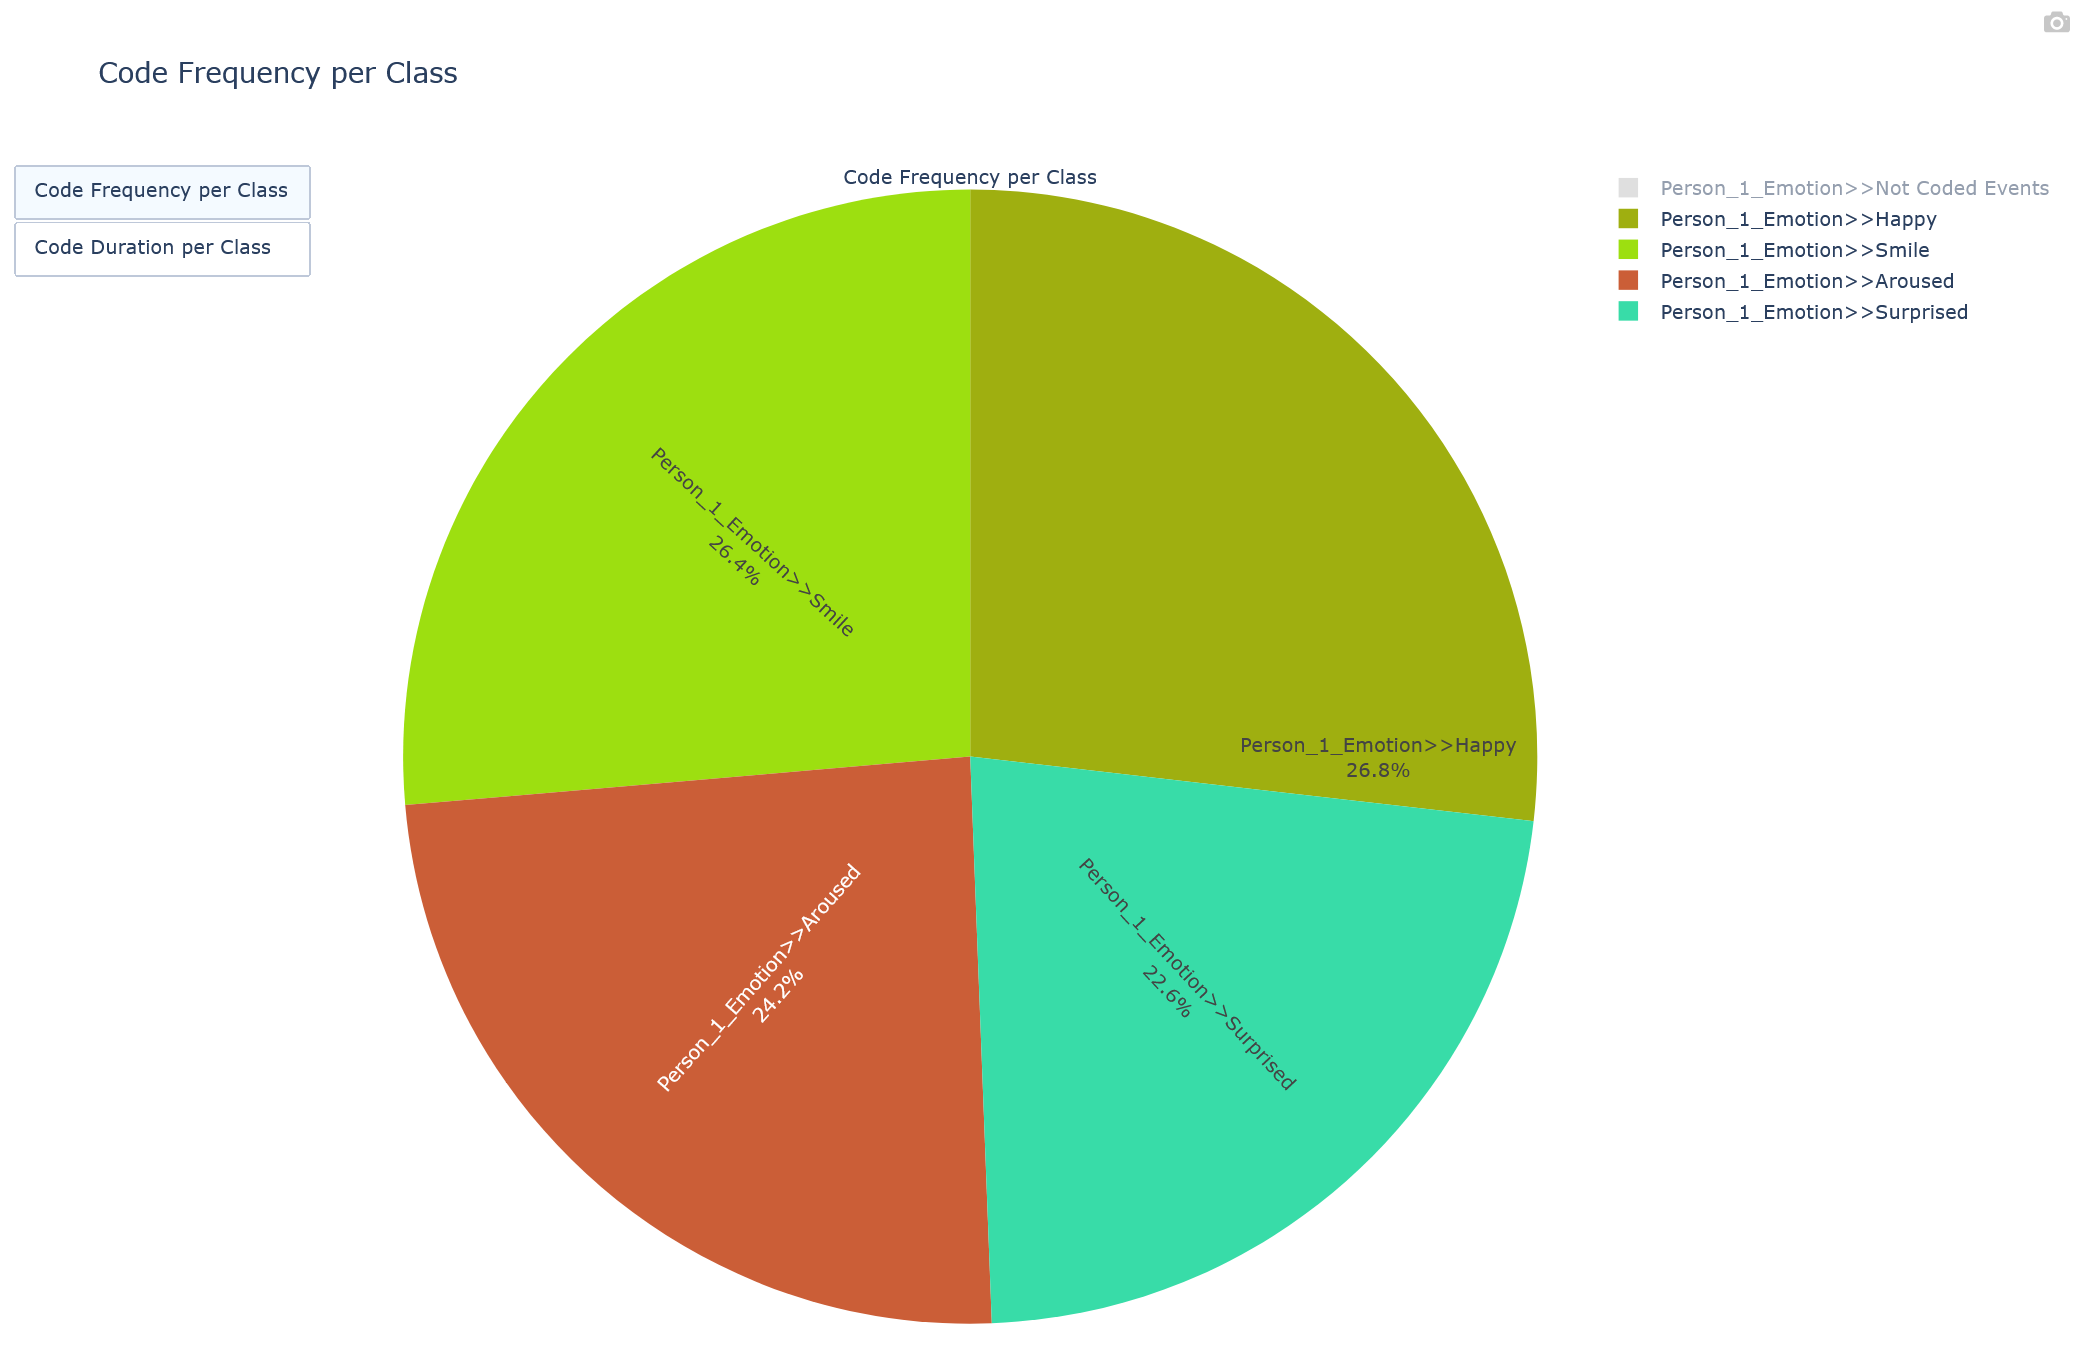
Graph Options
oSwitch between Frequency and Duration by clicking on the two buttons in the upper left corner.
oThe legend on the right shows the colors and available Class-Code combinations.
To Code with the the highest percentage is shown at the top of the legend.
oThe colors are pulled from your local Code Archive.
oYou can remove Codes from the chart by clicking on a Code in the legend.
That Code becomes inactive for this chart. Click again to reactivate that Code.
In the top right corner of the diagram there are some icons to adjust the view of your diagram:
oExport screen shot - To export the current graph, click the little Camera icon in the top right corner.
| TIP: | The resulting png file is stored in the default downloads folder, as specified in the storage settings of your browser. If your browser is set to 'automatic save all downloads', each downloaded chart png is automatically stored in this default download folder as a 'NewPlot' file. A sequence number is automatically added to each file name, to prevent overwriting previously saved files. To change this behavior, alter the download settings of your browser. BEWARE: This setting affects ALL downloads! |
Note: The numbers for this chart are available in the Class Report.