In the INTERACT Help, the section Move DataSets Virtually in Time explains the various ways you can virtually shift already coded data for better analysis.
Because data comparison for a limited time frame (starting from a specific Event) is an often requested issue, this topic offers an example on how you can synchronize all DataSets, based on a specific Code and limit the analysis time frame.
Example: Presume you have collected data for multiple test subjects (hundreds if need be) and the data of each subject is collected in a separate DataSet*. Those sessions did probably not happen simultaneously, so the recorded data is available in one or more large video files.
While coding those tests, each Event receives chronological time codes, because this is how things really occurred. This results in correct, but hard to compare behavioral data. Visualized this data can look like this:
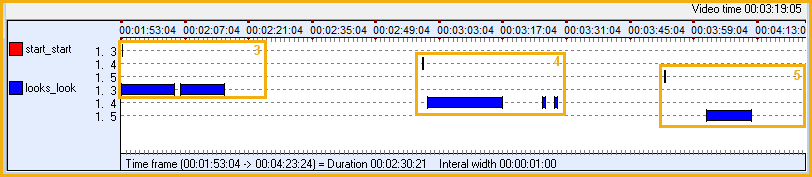
Each DataSet is represented by a single line, the numbers in front identify the DataGroup and the DataSet the data belongs to.
*If those sessions are stored in different data files, use one of the File - Files - Merge routines, to create a compilation file with all data to be compared. For details, read Merge Documents.
As you can see, in this small Timeline Chart extract, the Codes of separate DataSets are ordered successively: The red 'start' Codes for each session, should be aligned in order to compare this data.
In this experiment, we want to compare the reaction of our test subjects in the first 60 seconds after the Code 'start' was coded. We also want to see what happened the last 10 seconds before this Code was coded.
In order to do this, we have to combine two different functionalities of INTERACT:
oSynchronize on Code
oDefine a Time based Interval
Synchronize DataSets
First we need to synchronize our data, by virtually moving all DataSets to their sync point: The occurrence of our 'start' Code.
To synchronize this type of data, based on a specific Code Event, this Code needs to be available in each DataSet.
▪Open the data file in which you want to synchronize the DataSets (Merge multiple data files to get an overall comparison)
▪In the toolbar, select Transform - DataSets -Time Shifts ![]() > Sync to Code .
> Sync to Code .
▪Select the Class and Code you want to use for synchronization, from the upcoming dialog.
A second dialog appears, asking for point the time to which Events are synchronized.
▪We entered 00:00:10:00 (to still see the Events that occurred in the last 10 seconds before the selected Code was first logged).
▪Confirm with OK.
INTERACT now enters the appropriate DataSetOffset command, for each DataSet, into the the Transcription field of each DataSet. This synchronizes all data at the first occurrence of the selected Code.
▪Click Analysis - Evaluation - Timeline Chart ![]() , to recreate your Timeline Chart.
, to recreate your Timeline Chart.
▪Click Align on Zero ![]() , to hide all Events that now lay virtually before zero. This is important to get the correct statistics.
, to hide all Events that now lay virtually before zero. This is important to get the correct statistics.
IMPORTANT: Only if you click the Align on Zero ![]() icon (to hide all Events logged before the new, shifted start time) those preliminary Events are no longer present in the statistics!
icon (to hide all Events logged before the new, shifted start time) those preliminary Events are no longer present in the statistics!
The same data as shown in the first TLC picture now look like this:
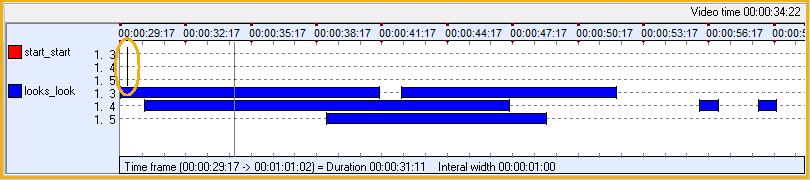
As you can see, all 'start' Codes now appear at the far left (00:00:10:00) and all other Codes have moved accordingly.
Select Time Interval
To perform the second part of our mission, we have to define the time interval of 60 seconds:
•Click the Select interval ![]() icon, in the Timeline Chart toolbar.
icon, in the Timeline Chart toolbar.
•Enter 00:00:60:00 in the interval field of the upcoming dialog.
•To exclude the 10 seconds before our 'Start' Code, enter 00:00:10:00 as your start time.
•To enter the correct End time, click the next interval ![]() icon.
icon.
•Confirm with OK.
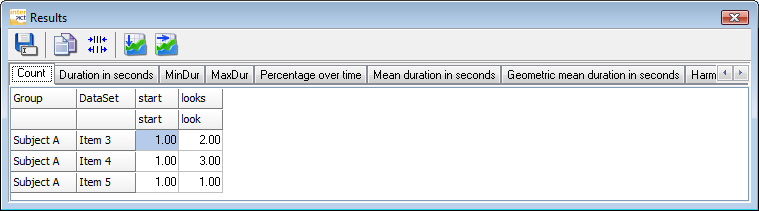
The Timeline Chart now displays exactly the first 30 seconds after the 'Start' Code for each DataSet, allowing you to compare all statistics instantly and accurately, because all Timeline Chart statistics are based on the visualized part of the data!
•Select Analysis - Full statistics from the Timeline Chart menu, to get all statistical values of the selected Codes for the first 30 seconds of each DataSet:
Ignore or Use Defined Time Offsets
If the results and TLC chart look exactly as before, although the DataSetOffset command is entered in the transcription field of each DataSet, the option that tells INTERACT to use those offsets, is probably turned off:
•Open the Timeline Chart window.
•Click on the Options ![]() icon.
icon.
•Switch to the tab 'General'.
•Select Use defined time offsets and confirm with OK.
•Clear the selection, to see your results without the offsets being used.