The SSG timeline is located at the bottom of the State-Space-Grid window:
|
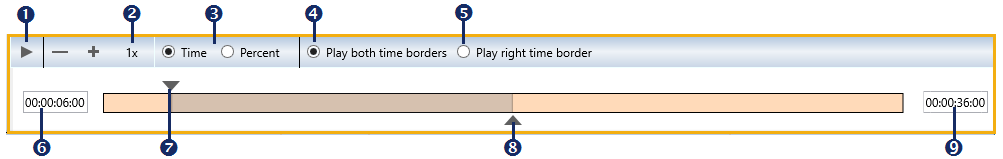
Play button - If you limit the selection* of the currently displayed data using the time line, this icon allows you to playback the occurrences in the graph. |
|
Play speed - Use the - and + icons to increase or decrease the playback speed. |
|
Speed reference - Determines the origin and scale for the play speed. - Time represent the default setting, for which the play speed 2x means simply twice as fast. - Percentage translates the total duration of all visualized observations to exactly 100 seconds, independent of the real duration - which might be days, months of even years. Those one hundred seconds are handled as 100%. This means, that increasing the play speed to 2x reduces this percentage based time frame to 50 seconds. This allows you to speed-up playback for long term observations easily. |
|
Play both time borders - The selected interval moves in constant size through time. Events appear and disappear, matching the period reached. |
|
Play right time border - The selected interval is automatically increased during playback. The start time ( |
|
start time of the currently visualized selection. |
|
start time border, a slider to adjust the beginning of your selection. |
|
Offset border, a slider to adjust the end of your selection. |
|
Offset of the currently visualized selection. |
On calling the State-Space-Grid routine, the total duration between the start time of the first and the offset of the last Event, within the selected data, is covered.
*) You can limit the visualized time frame, with the help of the time line and its sliders at the far right and left:
▪Use your mouse to drag the time borders (![]() and
and ![]() ) in the required position.
) in the required position.
Play Events
If you select only part of your data, you can visualize your data like a video played within the State-Space-Grid table:
▪Drag the Offset ![]() border to the left, to limit the period that is displayed.
border to the left, to limit the period that is displayed.
▪Select the option Play both time borders![]()
▪Click Play ![]() to start the animation.
to start the animation.
The selection moves along the time line at the selected speed, simultaneously the circles that represent the Events come and go as they have been coded within the currently selected interval.
Note: Select the option Play right cursor to extend the selected period while playing, showing more and more Event circles as time passes.
| TIP: | Adjust the playback speed with the help of the + and - button in the speed section |