Based on the currently displayed time frame, the State-Space-Grid windows also offers some statistics, based on the currently visible circles, in comparison to the content of manually selected cells:
▪Switch to the Measures tab within the left window pane.
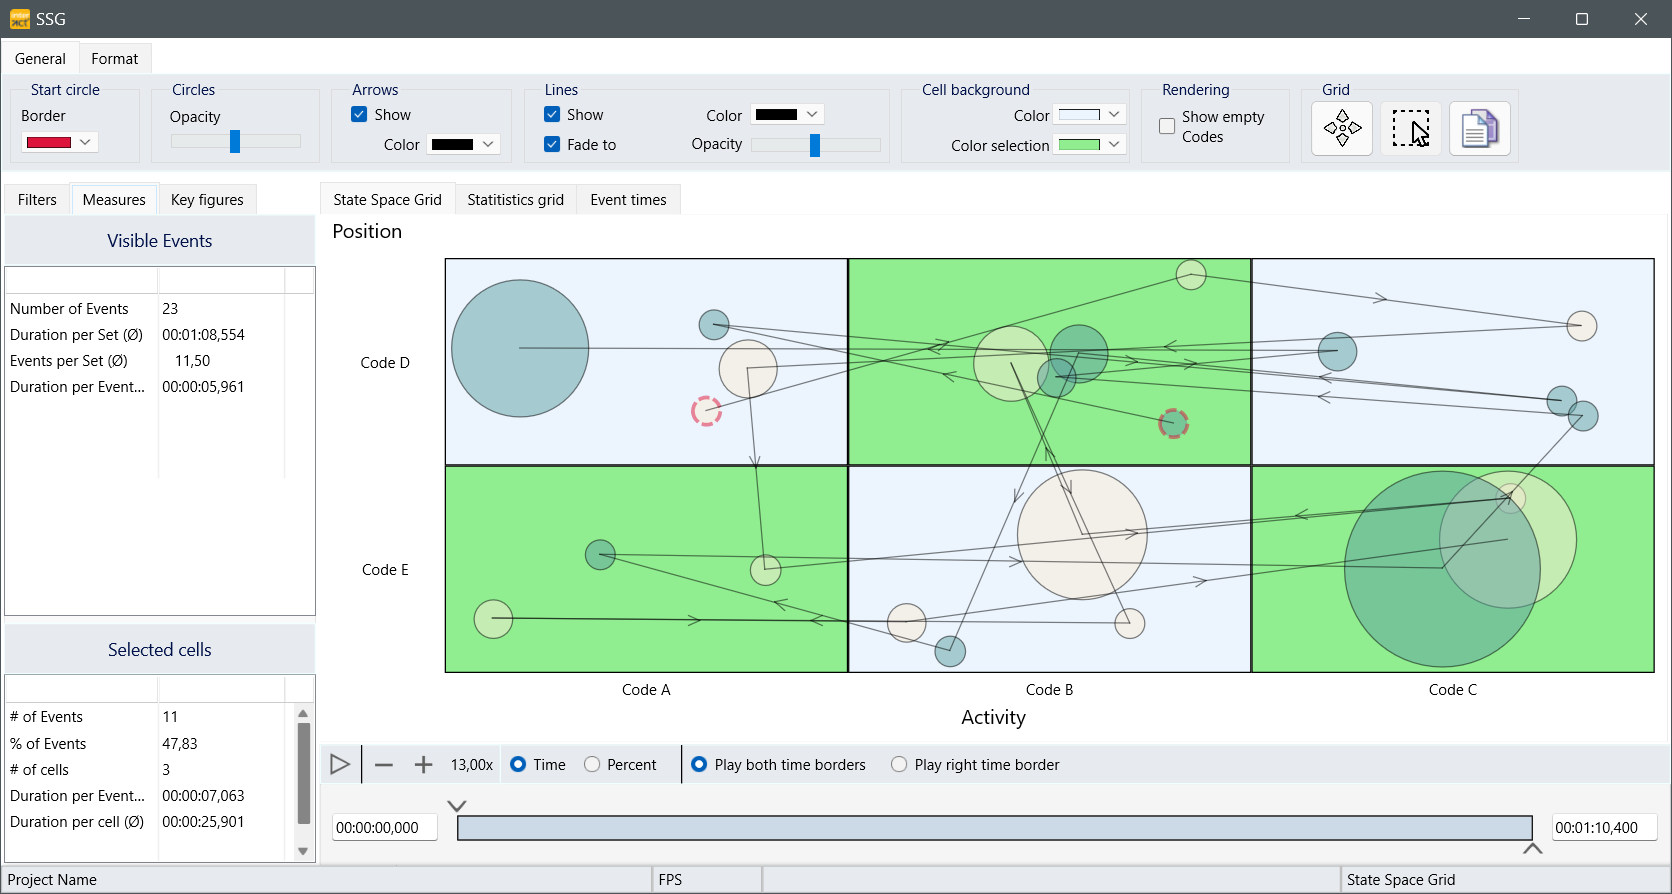
Visible Events
In this section the listed values are based on all currently visible circles. You can influence the number of visible Events as explained in SSG Data Visualization.
The statistics provide the following information:
•Count of Events - The number of currently visible Events.
•Duration per Set (Ø) - Average Duration per Set, based on the total duration of all Events.
•Events per Set (Ø) - Average number of visible Events per Set.
•Duration per Event (Ø) - Average duration of the visible Events.
Selected Cells
In this area, the listed values only reflect the Events that are located within in the currently selected cells:
•# of Events - The number of currently visible Events, located inside the selected cells.
•% of Events - Percentage of the number of Events within the selected cells in comparison of the total number of visible Events.
•# of Cells - Number of currently selected cells.
•Duration per Event (Ø) - Average duration of the visible Events that are located within the selected cells.
•Duration per Cell (Ø) - Total average duration of the currently visible Events located inside the selected Cells.
Cell Selection
To get statistics on only specific behavioral combinations, it is possible to manually selected the corresponding cells:
▪Select the Selector ![]() icon at the far right of the General toolbar.
icon at the far right of the General toolbar.
▪Click into the cells you are specifically interested in.
▪Click into a selected cell to clear the selection.
Selected cells can be recognized by the different background color.
▪Specify that color under General - Cell Background - Selection Color.
Note: The selection is only valid for the current State-Space-Grid session. The moment you cal the routine again, the selection is cleared.
Rearrange Circles
As stated before, the position of the circles within a cell is fully random.
If you feel that re-arranging some circles within a cell makes the results more readable, this is how you can do that:
▪Select the Shifter ![]() icon at the far right of the General toolbar.
icon at the far right of the General toolbar.
▪Click on a circle you want to move and drag it to a better position.
IMPORTANT: The new position is only valid for the current State-Space-Grid session. The moment you call the routine again, the circles are again drawn randomly.