The State-Space-Grid (Lewis, Lamey & Douglas, 1999) creates a graphical landscape of dyadic interactions that is important for measuring and understanding synchrony and flexibility in dynamic systems in activities or interpersonal relationships.
Originally used for research on socio-emotional outcomes (acting, feeling, and thinking), the state-space grid in Mangold INTERACT software also has great value for analyzing any type of process, e.g., in teaching research (understanding teacher-student interactions or state changes in whole classrooms), ergonomics or usability research (understanding processes and workflows and measuring their efficiency), or similar applications.
The Mangold INTERACT State-Space-Grid implementation allows to render the collected codes in a time-dynamic diagram. This is very helpful to understand state changes and thus whole processes.
The Mangold INTERACT State-Space-Grid visualizes the relationship between two categorical variables that are synchronized in time and visualizes the overlapping situations for all Codes of two different Classes in a matrix in which each cell represents an overlapping situation of two Codes.
State Space Grid in INTERACT
Details about the algorithms behind this routine can be found in publications from Tom Hollenstein. The method and corresponding restrictions are explained in his publications.
IMPORTANT: Because the State-Space-Grid visualizes the co-occurrences between to Classes, this routine requires mutually exclusive Codes per Class! Additionally, it requires Events for different Classes that overlap in time.
Compatible Data
Because of the preconditions required, not all data is valid for the State-Space-Grid visualization. The routine always produces some results, but those might not be plausible, simply because all overlaps within a Class are automatically removed!
The routine works best on mutually exclusive and exhaustive Classes:
oData that was collected with mutually exclusive Codes per Class is just perfect, as long as it holds at least two Classes.
oSequential Events that were coded with an hierarchical coding system, using lexical coding, works just as well.
oData that was collected for multiple subjects in a single pass, using the coding mode Complex, probably needs some restructuring, before the data is compatible with the State-Space-Grid:
Typically, this type of data holds co-occurring Events for multiple subjects.
The subjects are usually identified by a Code in a 'Subject' Class, which means that at least those Codes do overlap within the same Class!
The solution is easy enough, because INTERACT offers a restructuring command that enables you to split your data into separate DataSets per Subject.
The compilation file created by that routine can now be correctly analyzed using the State-Space-Grid.
If your data is compatible:
•Click Analysis - Dyadic - State-Space-Grid ![]() to start the routine.
to start the routine.
•If more than one DataSet is present in your data file, select the DataSets you want to include in the analysis.
The Space-State-Grid window (SSG) appears, showing the selected data on the 2D Grid tab:
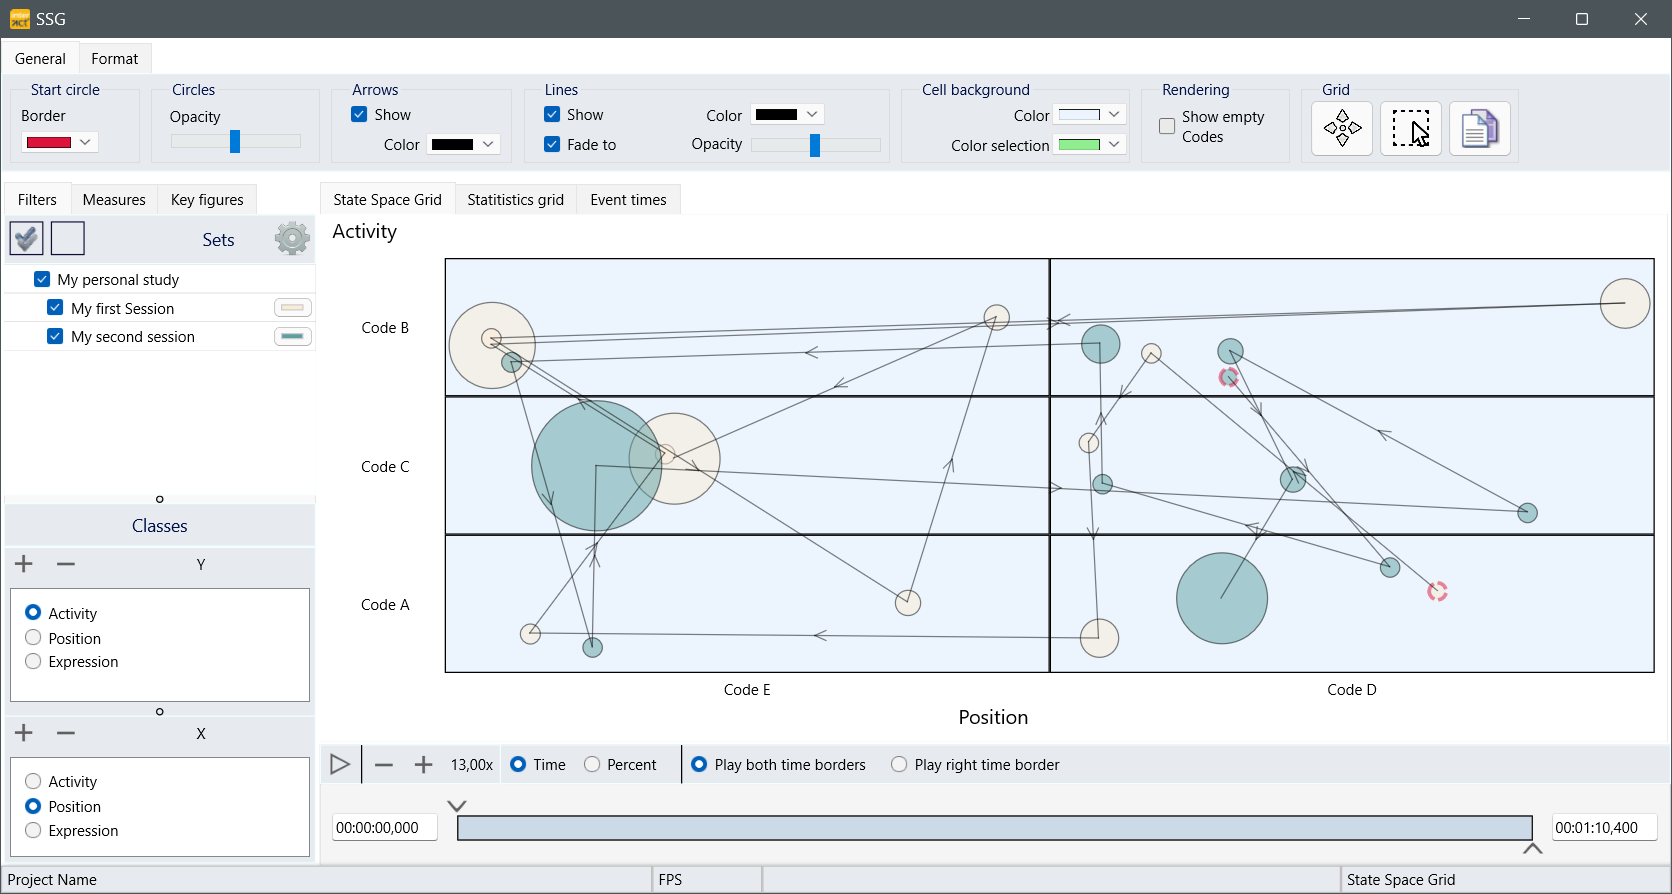
This grid displays the relation between two different Classes.
oEach cell in the grid represents the co-occurring combination of the two Codes from two different Classes, shown in the corresponding row and column on the X and Yaxis of the grid.
oPer DataSet, all Events are sorted by time.
oSeparate DataSets can be separate sessions or separate subjects from the same session. In that case, multiple session are better grouped in DataGroups.
oPer default, the total time frame, covered by the selected DataSets, is displayed.
oThe larger the circles*, the longer the two corresponding Codes were logged simultaneously, within the selected time frame.
oThe position of the circles within a cell is completely random.
Note: Circle size - The length of the longest combination is set to be 100% of the largest possible circle size within a cell. All shorter combinations are displayed as a percentage of this. All Events that cover less than 15% of the longest Event are drawn at the same size, to make sure they stay visible while resizing the SSG window. This means that a 1 frame combination might be displayed at the same size as a 3 second combination of behavior!
SSG Layout
The Sate-Space-Grid window consists of the following areas:
SSG Toolbar 'General'
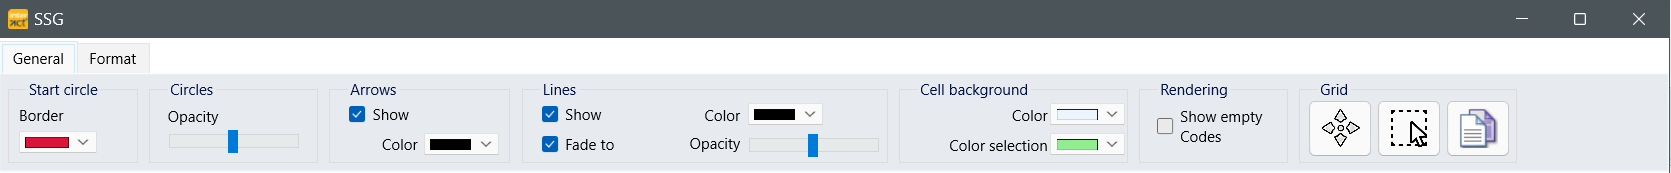
This toolbar holds various options to change the appearance of your data within your State-Space-Grid graph:
oStart Circle- The first Event of the currently displayed data. You can change the appearance of this first Event by changing the color of its border.
oCircles - All Events are represented by Circles. You can alter the transparency with the slider.
oArrows - To indicate the order of your Events, arrows can be displayed. You can specify the color of those arrows.
oLines - The lines, connecting the circles, represent the order of the Events and can be turned off and on to your liking. The Fading to option makes them grow over time. The color and the opacity of those lines can also be changed.
oCell Background - Specifies the general background color as well as the color of selected cells.
oRendering - Allows you to hide all events that contain no Codes or just one Code.
oSelection tool - Allows you to highlight specific cells. For details read SSG Statistics.
oShifter tool - Enables you to move circles within a cell, to improve readability.
oCopy icon - Copies the content of the grid in the Windows clipboard, so it can be transferred to another program.
| TIP: | Whenever you tick the Show Empty Codes check-box, the circles are re-sized within the available space. If you do re-size the SSG Window, the available space will differ. So depending on your needs, you should pay attention to the order of re-sizing and enabling or disabling the Show Empty Codes option. |
Selection Tabs
The area at the left of the SSG window offers the following sections:
oFilters - Select the data to be visualized, as is described in SSG Data Visualization.
oMeasures - Displays calculated results based on the currently visible data.
oValue Types - To select the values that are visualized in the Statistics Grid.
Note: Re-sizing the SSG window automatically adjusts the size of the Grid and adjusts the height of the area listing the X-Classes.
You can adjust the height of all three data selection areas like this:
•Drag the bottom border of the Sets area to adjust its heights.
•Drag the bottom border of the X-Classes area to change the height of both the X-Classes as the Y-Classes area (increasing X reduces Y and vise versa).
Content Tabs
The main area of the SSG windows visualizes your data in different sections:
oState-Space-Grid - Shows the typical State-Space-Grid visualization for the co-occurrences between the two selected Classes.
oEvent-Times - Provides a list with raw data, containing all coding segments for the currently selected classes. If your data contains overlapping Codes for the selected Classes , the Stat-Space-Grid routine removes all overlaps (=errors).
oStatistics-Grid - Displays the summary of the selected value type for co-occurring sequences of the visible Codes. Details in SSG Statistics.
•
| TIP: | To make a screenshot of a specific part of this window, use Windows' Snipping tool. |