It is also possible, to play back an interesting part of your video from within the graphical representation of your data!
▪Click Analysis - Evaluation - Timeline Chart ![]() to open the Timeline Chart.
to open the Timeline Chart.
Note: To learn all about creating and configuring this Timeline Chart, read the section DataSet-based Statistics.
▪Select the Codes, Classes ands Sets you want to analyze.
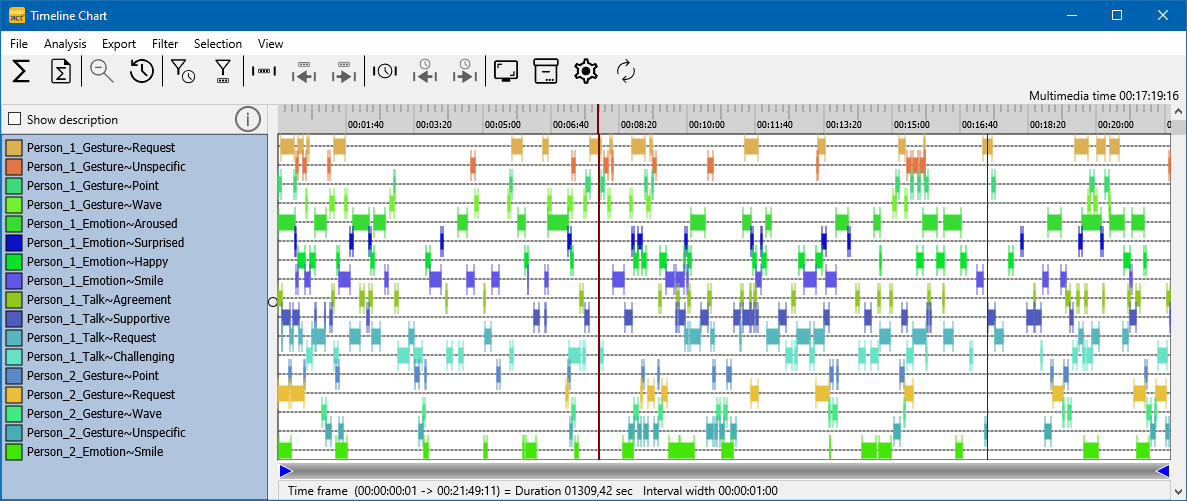
▪Click into the chart to position the currently open video(s) to the corresponding point in time.
▪Press Play ![]() , to see a vertical line moving along the visualized Codes.
, to see a vertical line moving along the visualized Codes.
Note: The thicker red line represent the current position in the video, the thinner red line indicates the hovering position of the mouse.
Play Selected Area
If you discover an interesting behavioral pattern and want to take a closer look at it, exactly this part can be played-back right from within the Timeline Chart window:
▪Right-click with your mouse at the beginning of the interesting part.
▪Keep the mouse pressed and drag the mouse cursor to the end of the part of your interest.
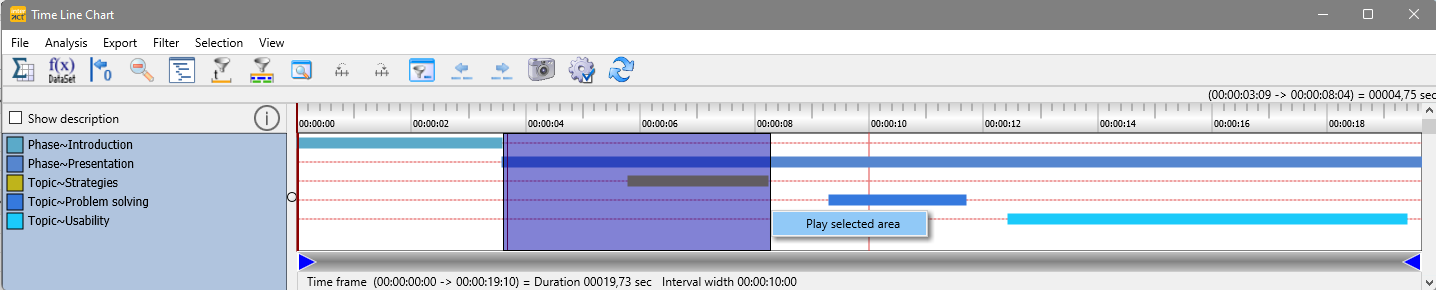
▪Choose Play selected area from the now appearing context menu.
INTERACT now plays exactly this part of the video for you.