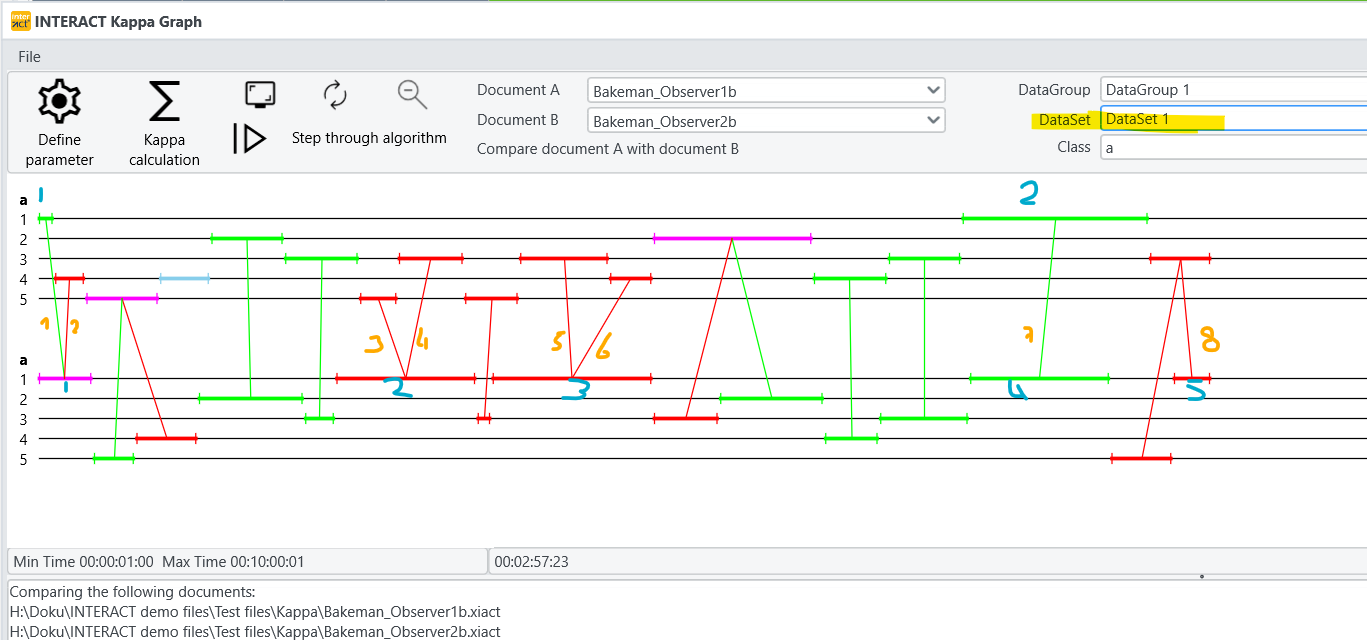
The Kappa Graph visualizes the results of the Kappa Pair Finding Routine, but to get the numbers on those pairs found, you need to open the Results.
▪Click the button Kappa Calculation in the toolbar of the INTERACT Kappa Graph to get the values summed across all DataSets.
In the Results matrix, the sum of all found "pairs" is written into the green fields, building a diagonal line.
The results of the analysis are displayed in the Results dialog:
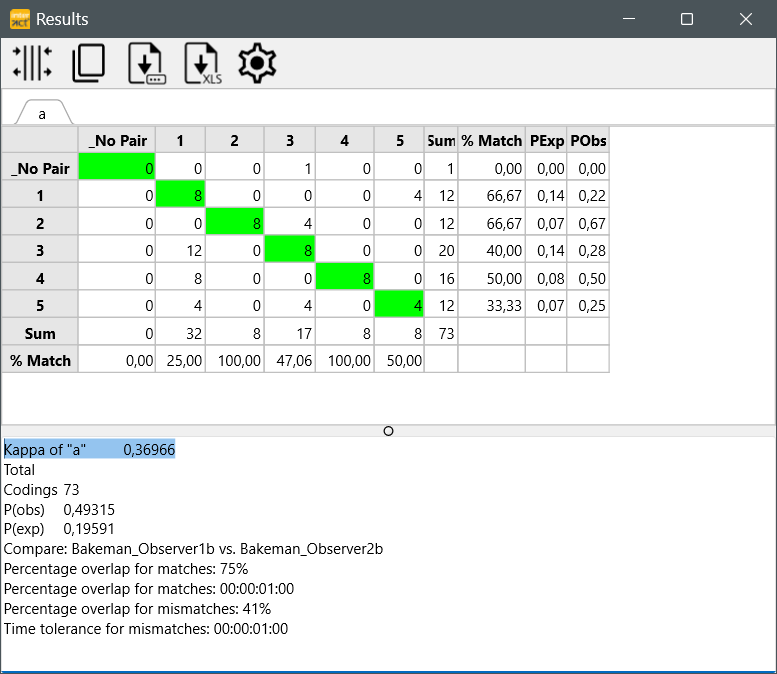
The information in the Kappa results dialog can be read as follows:
oEach Class is displayed in a separate tab.
oThe matrix gives you an overview of the pairs found, as well as an on how often the Codes did not match.
oAll entries in the diagonal green fields are the matching pairs found.
o% Match shows the percentage of agreement per Code.
oP(exp) lists the proportion of agreement expected by chance per Code.
oP(obs) lists the proportion of agreement actually observed.
If the observers did detect different behavior in the same time frame, their dissimilar codes are displayed in the other (white) fields.
Table orientation
oIn the rows you find the observations from the 'master' file (the file displayed first in the Kappa Graph - in this example Bakeman_Observer1b.xiact ), corresponding to the Codes in the first column.
The total number of connections found in a row is summarized in the Sum column.
oIn columns the identified results of the second file (in this case Bakeman_Observer2b.xiact ) are listed.
The total number of connections found is entered in the Sum row at the bottom of the table.
IMPORTANT: The total number in the Sum field reflects the number of connections and does not necessarily match the number of Events for that Code in the data file!
For example, if you notice any pink Events in the Kappa Graph, those Codes are linked to multiple Events in the other file, identifying matches and mismatches. All connections count!
For example: Looking at Code "1" from Class "a" we see two Events for the first file and five Events for the second file.
For the first file, only two connections exist. For the second file, eight connections exist:
The numbers are calculated per DataSet and than summarized across all Sets in the Results table.
In the lower part of the Results window you can find:
oThe Kappa value per Class.
oThe total number of codings (Events)
oThe overall P(observed) and P(expected) values,
oThe exact file names of the compared data files
oThe Kappa parameters that were used to get those results.
The order of file selection can influence the calculation of the Kappa coefficient!
Note: You can change the order of the selected documents in the Kappa Graph dialog.
Percentage of agreement per Code
In addition to the Kappa value, INTERACT offers a percentage of agreement per Code. This has been implemented for all those that cannot rely on the Kappa value, due to their coding system (less than 3 Codes per Class, very little Events etc.).
Independent of probability, the value in the green field (number of pairs found) is divided by the summary of its row as well as the summary of its column. Depending from what angle you look at the data.
This means, that for the first set of results, the number of found pairs is divided by the sum of the corresponding column (e.g. for Code '1' : 8 / 32 *100 = 25,00% ), whereas in the second set of results are based on the number of found pairs, divided by the sum of each line (e.g. for code '1' : 8 / 12 * 100 = 66,67 %).
This results in a percentage of identical codings per Code, enabling you to compare the results e.g. of the trainer with that of the students.
Note: The results largely depend on the specified Parameters. A detailed description of those parameters can be found in Kappa parameters.
Export results
▪Click on the Export to Excel icon to export all data at once into an excel file in which a separate tab is created for each Class, showing the result matrix per Class.
▪Click the Save as icon to save the results for the current class as a *.txt, *.csv or *.xls file. In this case, you need to explicitly enter the suffix, otherwise a *.csv file.
▪Click the Copy ![]() icon to get the results for ALL Classes into the Windows clipboard.
icon to get the results for ALL Classes into the Windows clipboard.
▪Paste those results into your favorite target application (e.g. Notepad, Excel, Word,...).
Adjust Parameters
If the results to not match your expectations, adjustmenting the initial parameters might improve the situation. You can return to the Kappa Parameters dialog from within the Kappa Graph dialog:
▪Click Define parameter to return to the Kappa Parameters dialog.