From within the Timeline Chart it is possible to export descriptive statistics per Interval.
This allows you to easily generate Time Series of your statistical results.
Open the Timeline Chart with the data you want to export.
▪Select Analysis - Statistics per Interval from the Timeline Chart menu.
▪Verify and adjust the available options to meet your needs:
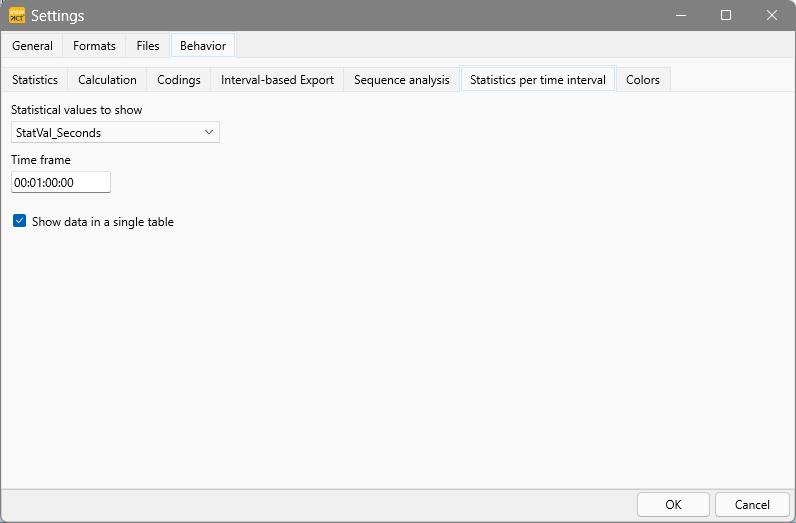
▪Select the value type you are interested in from the drop-down list.
▪Enter the time frame in which you need to export your data.
Select or clear the option Combine data into one table, depending on your needs
| One Tab per Interval - If you clear the option Combine data into one table, the results will be split into separate tabs per Interval: |
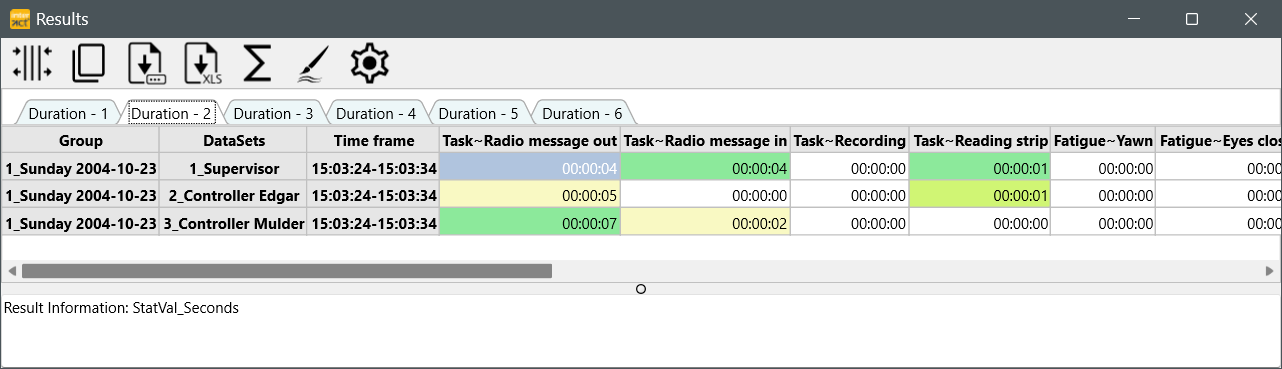
This format allows you to easily compare results for multiple Sets for the same interval.
| All Intervals combined - If you select the option Combine data into one table, all interval lines will be listed on a single tab: |
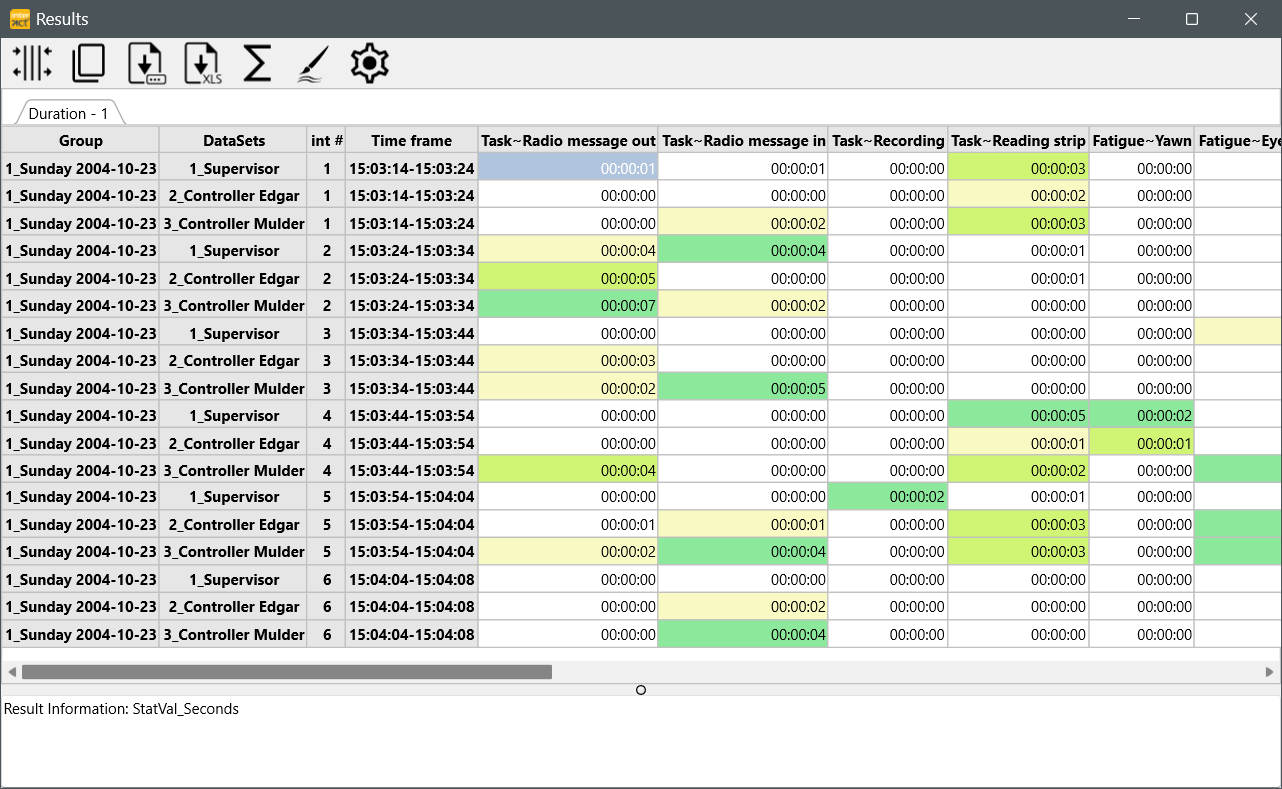
This format allows you to easily export all information to Excel for further processing. If your document contained multiple Sets, all Sets are listed per interval.
Transfer Results
To transfer or export your results to another application, you can:
oCopy ![]() the data and paste it into your target application.
the data and paste it into your target application.
oSave as.. ![]() a csv or text file
a csv or text file
oExport to Excel ![]()
A more detailed explanation can be found in Export Results.