Sequence Analysis was designed for mutually exclusive data.
Having multiple, overlapping behavior types per Subject, results in session data that is anything but sequential:
The Sequence Analysis routine is applied to all Events and Codes currently visible in the Timeline Chart.
The Sequence Analysis routine searches for the first start time within DataSet and remembers that Code. Than it searches for the next start time and labels this second Code as the successor of the first Code. Starting anew from this start time, it searches again for the next start time, labeling the Code found accordingly, etc.
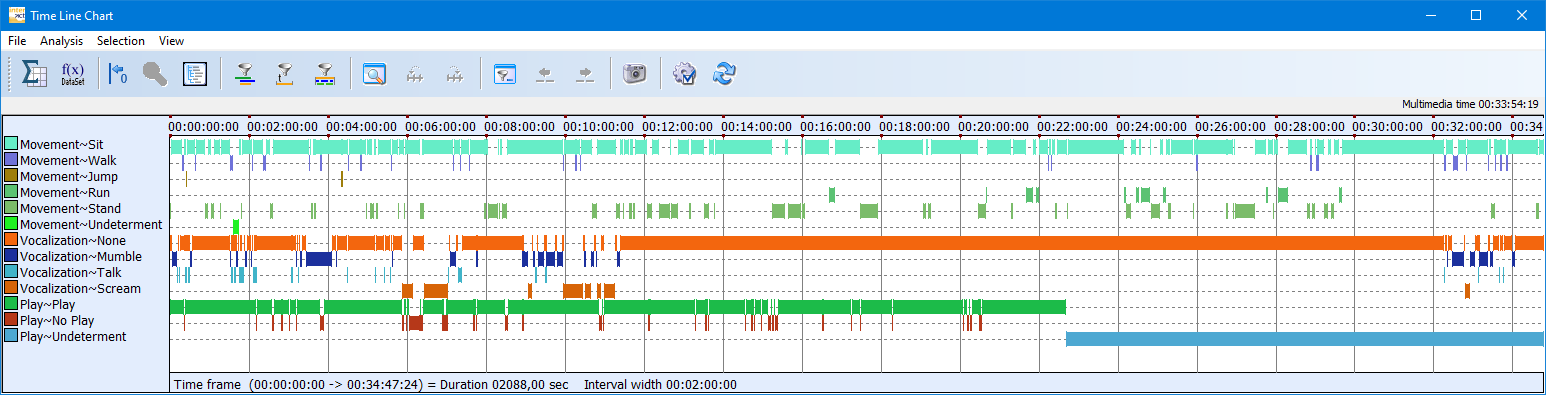
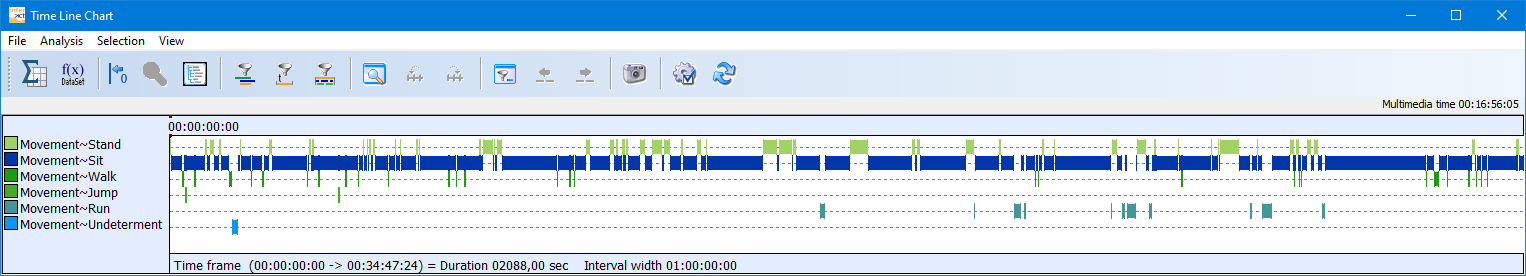
This means, that for identifying sequences for a single Class, you can simply select that Class on opening the Timeline Chart. For example, to look at the sequences within the Class 'Movement', you open the Timeline Chart for this Class only:
LSA Results Lag 1
For the data in the Tim Line Chart, the following sequences are found:
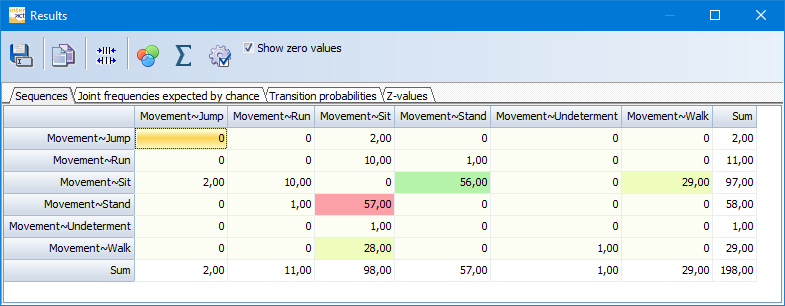
It shows that this subject was switching between standing and sitting 57 times.
Run Sequential Analysis
Note: For accumulated results, you can do this for all subjects at once, because the routine only searches for sequences within a DataSet, so data from other subjects does not interfere.
Note: Make sure analyze ONLY the Codes that are logically of interest for the sequence analysis process.
▪Open your data file.
To open a demo filer select Start -Files - Open ![]() > Demos > Documents > Document: Sequence Analysis demo.
> Demos > Documents > Document: Sequence Analysis demo.
▪Select Analysis - Evaluation - Statistics ![]() >Lag Sequencial Analysis from the toolbar.
>Lag Sequencial Analysis from the toolbar.
In this sample data, all data is mutually exclusive and can be analyzed as a whole instantly.
If your data contains multiple Classes and overlapping Codes, probably NOT all data must be analyzed at once.
▪Select only the applicable Codes.
▪Confirm your selection with OK.
The Sequence Analysis settings dialog appears:
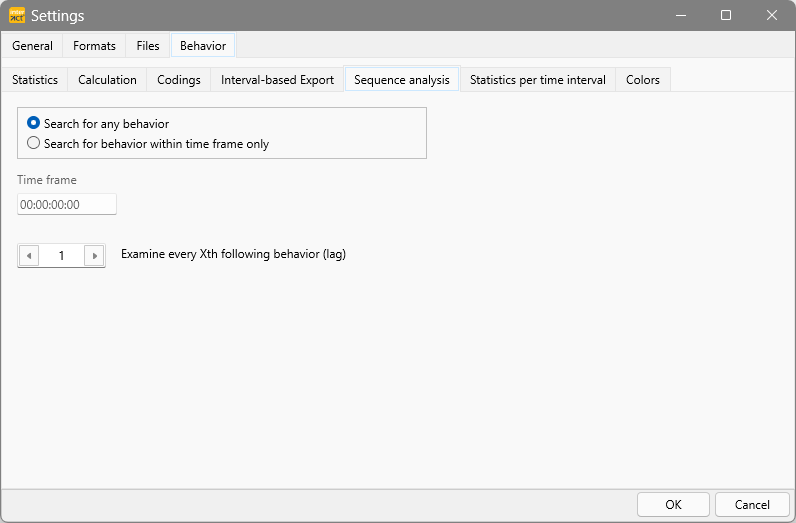
▪Verify your search details as explained in Accuracy of Calculation.
▪Confirm your choices with OK.
Note: The routine searches for start times only!
Explanation: During the sequential analysis, INTERACT examines all available codes chronologically from start time to start time, ignoring all offsets.
The routine identifies the first start time in the selected data pool, notes the corresponding Code, and searches for the subsequent start time.
That subsequent Code is counted as a sequence of the previous Code. After that, this subsequent Code is memorized, and the search for the next start time continues, and so on.
If there are overlapping Codes with the exact same start time, it is NOT a sequence and only one of the Codes is counted, that is why it is important to know what you are looking for and to analyze only Codes that make logically sense for the analysis.
- Usually, you'll need to analyze your data Class by Class.
- Overlapping Events that should be analyzed as their combined behavior need to be turned into sequential Events with help of the Create Coding Segments routine.
- Lexical Codes need to be combined to an aggregated Code with the Move & Combine routine.
| TIP: | To visually verify the results, first load the data to be analyzed for a single DataSet into the Timeline Chart and only call up the sequence analysis from within the Timeline Chart window. |
Sequences Found
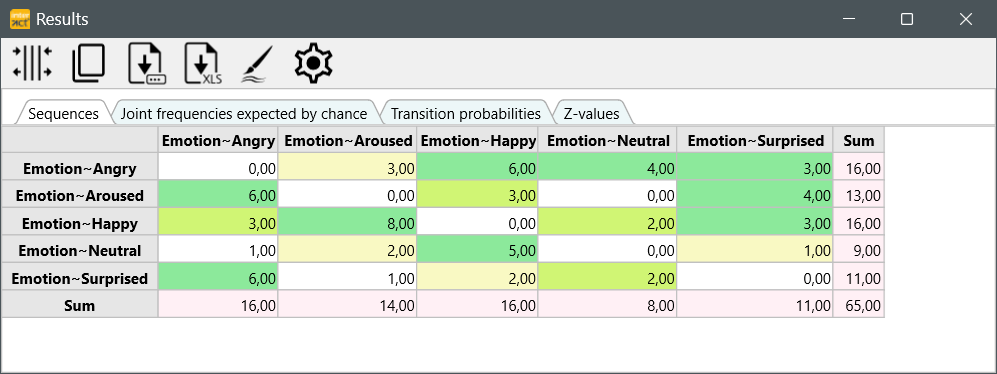
INTERACT creates the following matrix on the tab Sequences:
| TIP: | Adjust the width of the columns, either by hand or optimized by the Optimize |
The 'Results' matrix contains the plain counts on how often a certain Code is followed by another, starting from the start-time of the preceding Event until the next start-time found. Those values are used to calculate the resulting probabilities and z-values.
oAll available Codes are listed twice: once as row labels and once as column headers.
oHorizontally, the values represent the number of times the Code in the row was followed by the Code in the header, according the chosen lag. Per default lag = 1.
oCounted is always the first* Code found, since the previous Code has started, within the same DataSet - independent the Class and independent of the fact whether the previous Code has ended yet!
oThe resulting values are accumulated over all selected DataSets.
oVertically, the Codes in the column header are preceded by the Code in the row, as often as listed.
oIf you compare the total number of Events (N) to the total summary of the transitions, you see, that the total is always N - lag. In this case 137 Events - lag 1 = 136.
IMPORTANT: To get reliable results, do only apply the Sequential Analysis routine to mutual exclusive data. If your coding system is not mutual exclusive, but some of the Codes are, you can apply the Sequential Analysis routine on those Codes only. Events that do overlap in the Timeline Chart, may falsify the results.
Make use of the Pattern segmentation routine, to create sequential segments from overlapping behavior.
*) you can also search for the second (lag 2) or third code (lag 3) by adapting the Sequence analysis settings within the Timeline Chart settings dialog.
Sequences on Class Combinations
Finding sequences for certain combinations of behavior that overlap in time is possible too. For example, if you are interested in the segments covering a specific combination of 'Movement' and 'Vocalization'.
First you need to turn the combination you are interested in into a sequential string of Events, like for all situations were the participant is 'speaking' and 'standing' versus 'Quiet' and 'Sitting'. You can do this by extracting new Events from your data that represent the combination of Codes you are looking for.
Depending on the complexity of your codes and the combinations you are interested in, you have two options to create these new Events:
| Use the Co-occurrence filter - To extract Events for a limited number of combinations, this is an all time-favorite-routine within INTERACT's Timeline Chart. Running the routine twice would provide Events for all situations where the participant was 'standing and speaking' and 'Sitting and Quiet'. Read the topic Co-occurrence Filter for further information. |
| Use the Pattern segmentation routine - If you want to extract combinations for all Codes or for a large number of Codes, this rather new routine is you new best friend. For example, if you are interested in the sequences that result from combining all different situations that occur for the 'Movement' Codes in combination with the 'Vocalization' Codes. This routine is able to create a sequential string of Events from any number of overlapping Codes, as long as these overlaps occur for Codes in different Classes. Read the topic Pattern Segmentation for further information. |