As long as your data file contains a Set per Subject, all subject-based statistics are easy to get to.
Descriptive Statistics
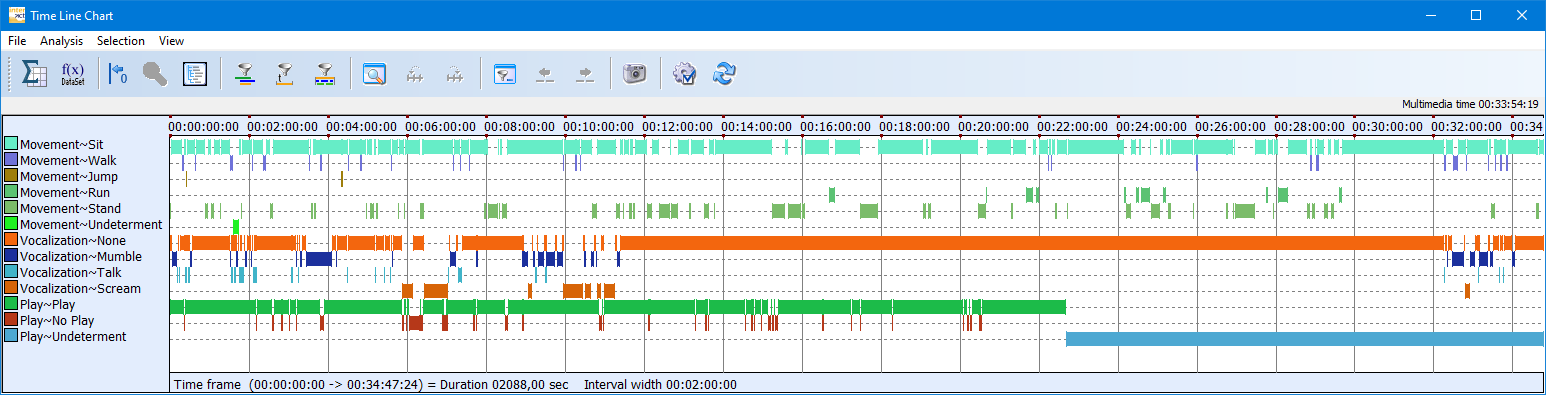
All Set-based descriptive statistics are based on the Timeline Chart.
▪Click Analysis - Evaluation - Timeline Chart ![]() to display your data chronological in the Timeline Chart.
to display your data chronological in the Timeline Chart.
▪Select the Codes and Classes you are currently interested in.
▪Select the Sets you currently want to analyze to see a chronological, graphical representation of your data:
▪Select Analysis - Full Statistics within the Timeline Chart window or click this Full Statistics icon ![]() to get the descriptive statistics for all selected participants.
to get the descriptive statistics for all selected participants.
The Results dialog offers a single line per Subject and a separate Tab for a range of statistics. The first five tabs are for interest to every one, the other depend on your research questions. All values are displayed in separate columns per Code and accumulated per participant:
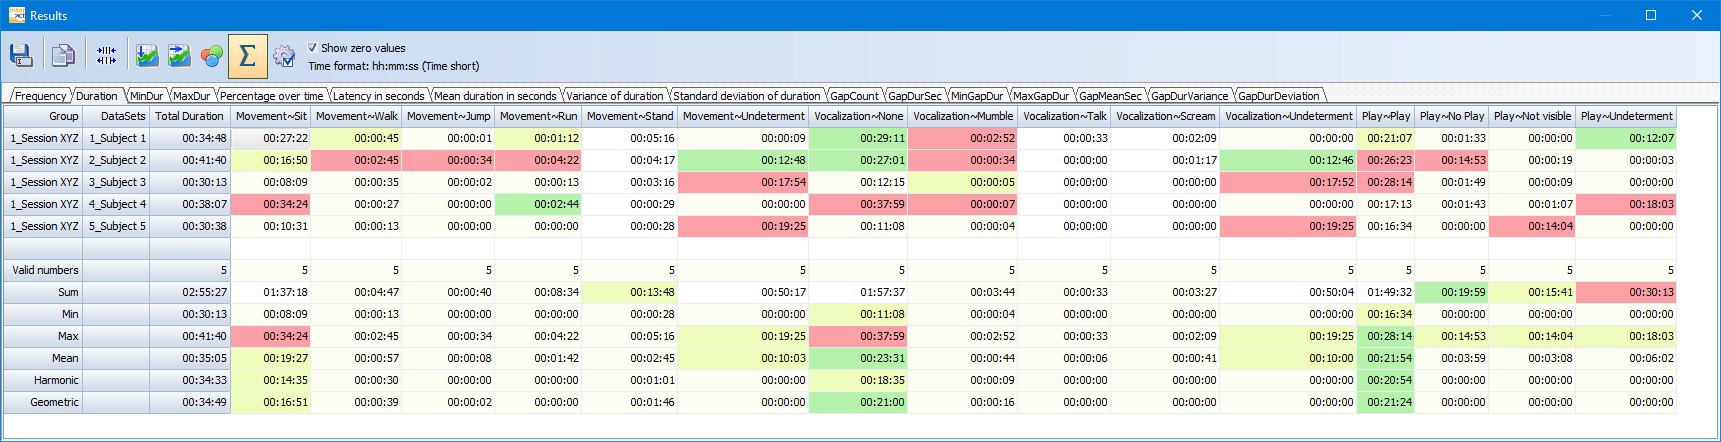
oFrequency - Number of times the Code was logged
oDuration - Total duration of the Events that hold this Code
oMin Duration - Shortest Event that holds this Code
oMax Duration - Longest Event that holds this Code
oLatency - Time until the first occurrence of this Code since the start of the session
oPercentage over time - Percentage based on the total duration of the session and the accumulated Duration of this Code
State-Space-Grid
As soon as you have two or more Classes, the State-Space-Grid (SSG) is a great way to visualize the co-occurrences between Codes of two Classes and do so for all Subjects at once.
IMPORTANT: In the SSG Codes may not overlap within the same Class! If your data contains gaps, you can remove the disturbing lines to the loewer left corner by deactivation the option Show empty Events.
▪Click Analysis - Dyadic - State-Space-Grid ![]() to start the SGG application.
to start the SGG application.
▪Select the Subject-Sets you want to display.
▪In the SSG window, select the Classes you are interested in for the X and the Y-Axis:
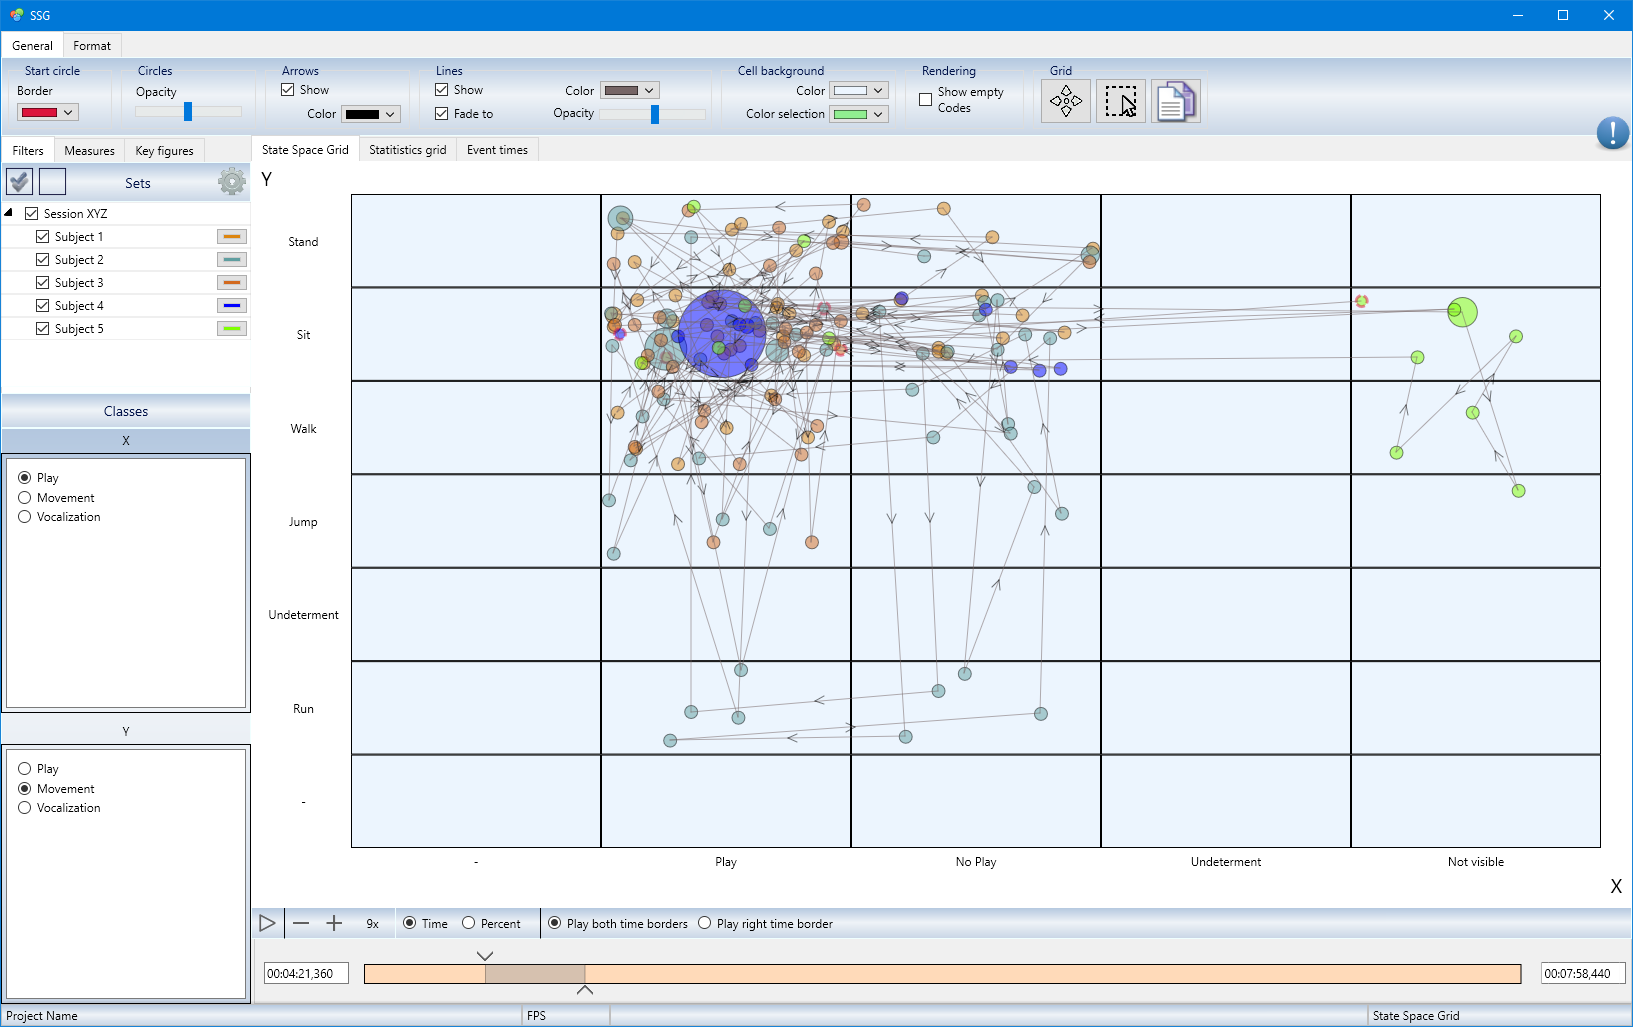
Each cell represents the co-occurrence of the corresponding codes displayed on the X and Y axis.
Each Subject is visualized in a different color. You can remove Subjects by clearing their selection in the upper left Sets pane.
The Statistics Grid provides the calculated values to the currently visible circles per Cell (=Overlapping situation between the selected X and Y Classes)
▪Adjust the time line selection at the bottom to limit the time span visualized and calculated.
▪To get the details per Subject, click Export within the Statistics Grid and select the option 'Split per DataSet'.
Further details about this analysis tool can be found in the section State-Space-Grid.
| TIP: | If you like this type of visualization, but your data is in one Set for all Subjects, it takes just one command to split your data into separate Sets per subject! Details about that command can be found in Split Events into Separate DataSets. |