With this tab you can control what statistical calculations are displayed.
▪Click the Settings ![]() icon, within the Time Line Chart window.
icon, within the Time Line Chart window.
▪Switch to the Statistics tab.
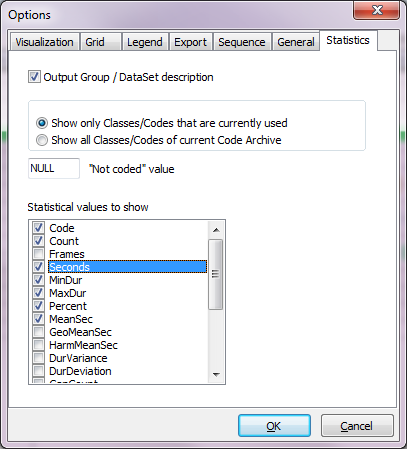
•Output DataGroup / DataSet description - This option ensures that the descriptive information on Group and Set level appears in the statistical reports.
•Show only Classes/Codes that are currently used - Per default, the Time Line Chart statistics only shows Classes and Codes that are coded within the current document.
•Show all Classes/Codes of current Code Archive - Check this option if you want all Codes, available within the current Code Archive, to appear within the statistics, even if they were not coded in the current selection. This ensures an identical number of columns (Full statistics) or lines (Statistics per DataSet), which is important if you want to compare or process your data any further. It requires a clean Code Archive though!
•"Not coded" value - If you activate the option Show all Classes/Codes of current Code Archive, you can specify the way Codes - that where not coded in that specific file - are displayed. Depending on how you want to further process your data, you can change the default NULL value to 0 or something else.
Statistical values to show
Note: Only the value types that are selected in this list are shown in the statistical results of both of the Time Line Chart statistics (DataSet analysis and Full statistics).
An overview of all value types can be found in Column declaration.
▪Select the value types you want within the Statistical values to show list.
▪Confirm your settings with OK.
TIP:If you want to export the statistical values, it is advisable to display just the values you need. Especially if you paste the results in an Office document, because the document width of a Word document is not sufficient to display all data in a readable table.