This command Full statistics ![]() in the Time Line Chart does not only offer a wide range of statistical values, it also enables you to create graphs directly from within the Results window!
in the Time Line Chart does not only offer a wide range of statistical values, it also enables you to create graphs directly from within the Results window!
IMPORTANT: The statistics, exports and analysis routines available within the Time Line Chart, always reflect the data currently visible in the Time Line Chart. If e.g. you are ‘zoomed in' on just a part of your data, only this part is taken into account.
The results of this command, basically offer you the same statistical results as available in the Statistics on DataSets. Only this time, the values are grouped by one statistical value per tab, with columns for each Class-Code combination and lines for each DataSet.
Note: This layout simplifies the processing of those results with other applications.
This view is especially useful for compilation files, after merging multiple data-files, or if you logged different test cases/situations in separate DataSets right from the start. This way, the results can be compared very easily. In statistical programs they speak of "cases".
Example: You created a DataSet for each session, which can be any kind of comparable test situation. You want to compare the data that was collected in this structure. To do so, use Full Statistics report and export the required results per type, so you can use them in any spreadsheet or statistical application.
▪Within the Time Line Chart window, click Full statistics ![]() .
.
The different metrics are now available on different tabs:
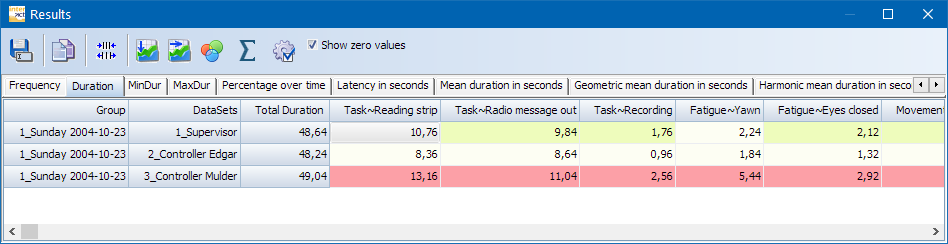
Note: Each type of statistical value is available on a separate tab. Per default all durations are listed in seconds.milliseconds.
The order of the listed Codes, is determined by their order in the assigned Code Archive.
To correctly compare multiple documents that belong to the same study, ensure that they are assigned to the same Code Archive!
Per default INTERACT displays only Codes from the current data-file, if you want to see all Codes that are available within the current Code Archive, you need to change the appropriate setting, as described in the Time Line Chart options - Statistics.
Totalling the Results for all DataSets
Totalling the sums per Code of all listed DataSets takes just a a single mouse click:
▪Click the ![]() Summary button to extend the current table like this:
Summary button to extend the current table like this:
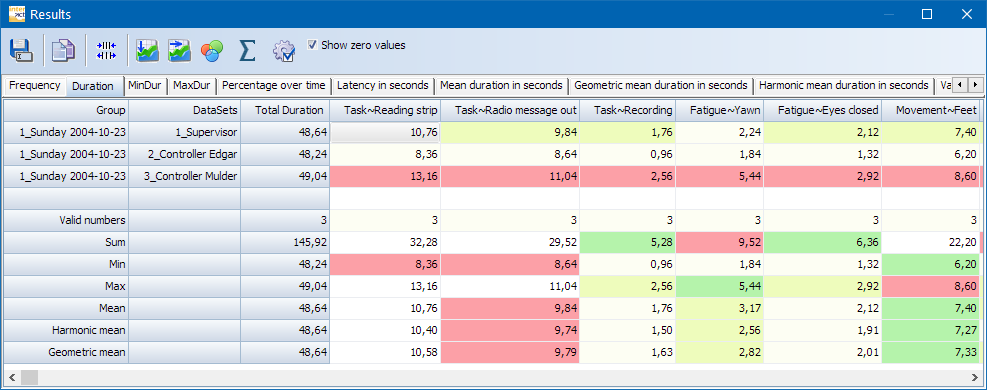
The available values tell you this:
•Valid numbers: Number of valid values found in the table for that specific column.
•Sum: Total of the listed values
•Min: Smallest value per Code
•Max: Highest value per Code
•Harmonic mean: Calculated of all listed values per Code - best applicable for rating values. Thus in this overview mainly useful for rating values within Independent variables.
•Geometric Mean: Calcuation based on all listed values per Code.
Visual Data Exploration
INTERACT offers a special visual data exploration routine, which is active per default:
▪The icon Visual Data Exploration ![]() in the toolbar, allows you (de)activate this functionality.
in the toolbar, allows you (de)activate this functionality.
All results are analyzed and colored like this:
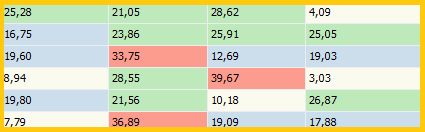
All values are compared and the range, between the lowest and highest value, is used to split the results into four groups:
•Beige is used for the values within the lowest 25%
•Blue is used for the values within the next 25%
•Green is used for the values within the third 25%
•Red is used for the values within the highest 25%
This gives you immediate feedback on your results.
Export
▪How to transfer this data to third party applications like MS Excel of SPSS is explained in Export Results; in most cases a simple Copy & Paste will do the trick.
| TIP: | In case the combination of the identifier for Class/Code is too long to be used in your statistical program, you can define global abbreviations for those identifier. Read more about this in the section The Code Archive, especially the topic Translate Statistical Results. |