Note: The INTERACT Sequential Analysis module requires a separate license. If you cannot find the command Sequential analysis in the Analysis menu of the Time Line Chart window, the command is not activated in your INTERACT version. Contact our sales team at sales@mangold-international.com, to learn how to you can obtain this additional feature.
Lag Sequential Analysis (LSA), is a technique for analyzing quantitative data, in which the sequential order of the data is examined. Originally published as the Allison and Liker method from 1982. In INTERACT we use the adapted version of Roger Bakeman and Thomas M. Gottman.
It is traditionally used in the field of developmental psychology, to study the behavior of person to person interaction (how often certain behavior is preceded or followed by other specific behavior) with the intension to accurately describe the collected data.
LSA can also be used for other tests, for example during usability studies, to identify typical errors or to trace operating progression.
With Lag Sequential Analysis, evaluators can generate statistics, that capture aspects such as frequency and conditional probabilities of behavioral Events.
This LSA routine was developed for mutually exclusive and exhaustive Codes!
In INTERACT, the Lag sequential analysis is available from within the Time Line Chart.
IMPORTANT: Only the Classes and DataSets visible in the Time Line Chart are analyzed!
Because of the Time Line Chart dependency, you are able to select only Codes that are mutual exclusive and search for sequences among those Code alone.
oHow to exclude certain Codes, Classes and/or DataSets is explained in Data Selection - Codes & Classes.
| TIP: | If the Codes you want to analyze are overlapping in time, make use of the Pattern Segmentation routine to create a sequential representation of your originally overlapping Events! |
The sequential analysis method used, was designed for data in which consecutive Codes may repeat (equal repetitive Codes are possible).
IMPORTANT: If your data relies on structural zeros on the diagonal, because consecutive Codes may NOT repeat, the expected frequencies cannot be computed with this method! For this type of data, it is best to use a program called GSEQ, which offers an import routine for INTERACT data-files.
Lexical Codes
If you coded multiple Codes per Event, those Codes automatically overlap - even per Event. For this type of data (in its original state), you can only identify sequences per Class. This means you need to visualize only one Class in the Time Line Chart. To combine the Codes from all Classes within a new Class column, so you can analyze all your combined data, use the routine described in Move & combine Codes:
•Click Transform - Codes - Move and Combine ![]() to start this routine, select all relevant Codes and create a new Target Class.
to start this routine, select all relevant Codes and create a new Target Class.
•Click Analysis - DataSet - Main Statistics ![]() ; select only your new <Target Class> for analysis.
; select only your new <Target Class> for analysis.
Multiple DataSets
Sequences are computed per DataSet only, independent of the fact if they overlap in time.
Note: Since INTERACT 14, it is no longer needed to concatenate multiple DataSets, to prevent the finding of sequences among different DataSets, due to the overlapping in time.
Run Sequential Analysis Routine
•Select Open ![]() > Demos > Example file for 'Sequential Analysis' or open your own file.
> Demos > Example file for 'Sequential Analysis' or open your own file.
•Click Analysis - DataSet - Main Statistics ![]() .
.
•Make sure to select only the Codes that are of interest for the sequence analysis.
•Confirm your selection with OK.
•Choose Analysis - Sequential analysis from the menu within the Time Line Chart.
Sequences
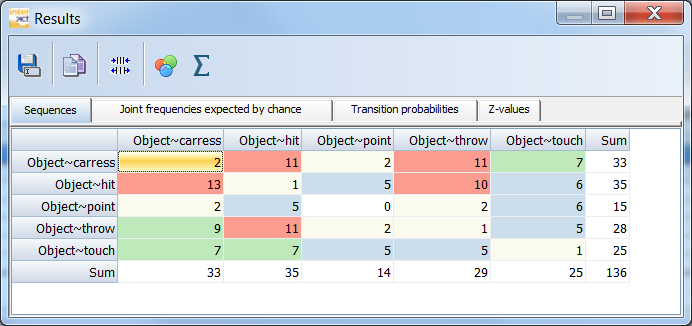
INTERACT produces the following matrix on the tab Sequences:
| TIP: | Adjust the width of the columns, either by hand or optimized by the Optimize/Maximize |
The 'Results' matrix contains the plain counts on how often a certain Code is followed by another, starting from the onset of the preceding Code. Those values are used to calculate the resulting probabilities and z-values.
oAll available Codes are listed twice: once as row labels and once as column headers.
oHorizontally, the values represent the number of times the Code in the row was followed by the Code in the header, according the chosen lag. Per default lag = 1.
oCounted is always the first* Code found, since the previous Code has started, within the same DataSet - independent the Class and independent of the fact whether the previous Code has ended yet!
oThe resulting values are accumulated over all selected DataSets.
oVertically, the Codes in the column header are preceded by the Code in the row, as often as listed.
oIf you compare the total number of Events (N) to the total summary of the transitions, you see, that the total is always N - lag. In this case 137 Events - lag 1 = 136.
IMPORTANT: To get reliable results, do only apply the Sequential Analysis routine to mutual exclusive data. If your coding system is not mutual exclusive, but some of the Codes are, you can apply the Sequential Analysis routine on those Codes only. Events that do overlap in the Time Line Chart, falsify the results.
Make use of the Pattern segmentation routine, to create sequential segments from overlapping behavior.
*) you can also search for the second (lag 2) or third code (lag 3) by adapting the Sequence analysis settings within the Time Line Chart settings dialog.
Visual Data Exploration
You can verify the results instantly, because
INTERACT offers a special visual data exploration routine, which is active per default:
▪The icon Visual Data Exploration ![]() in the toolbar, allows you (de)activate this functionality.
in the toolbar, allows you (de)activate this functionality.
All results are analyzed and colored like this:
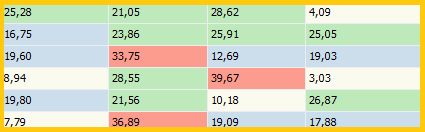
All values are compared and the range, between the lowest and highest value, is used to split the results into four groups:
•Beige is used for the values within the lowest 25%
•Blue is used for the values within the next 25%
•Green is used for the values within the third 25%
•Red is used for the values within the highest 25%
This gives you immediate feedback on your results.