This routine allows you to create sequential segments from overlapping Events.
Each segment lasts for a long as the current combination of Codes. The moment an additional Code appears, or one of the current Codes disappears, a new segment is created.
IMPORTANT: This routine only works properly for Codes that are mutually exclusive per Class!
| TIP: | Take a look at the detailed example described in the section Collect Nested Observations with Different Duration, in which data is logged with the intention of using this segmentation command to get the required data structure for analysis. |
Segmentation
In order to make you understand what this routine does, we prepared the picture below:
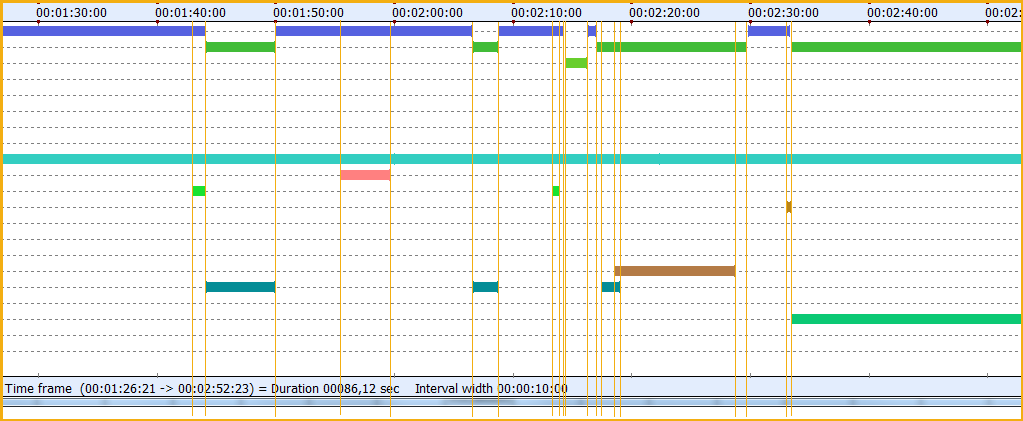
Presume you display your selection of Codes and Classes in the Time Line Chart. In this example chart, we drew vertical lines whenever the co-occurring pattern changes. This means, that between two vertical lines a segment holding a specific pattern of co-occurring Codes is located.
The pattern segmentation routine Transform - Events - Create coding segments ![]() creates new Events for each segment.
creates new Events for each segment.
IMPORTANT: If your data-file holds multiple DataSets, make sure you name your DataSets properly, BEFORE you run this routine: The DataSets in the new compilation files are sorted by (offset) time, so their order might differ from the original file!
Create Coding Segments
The current implementation of this powerful routine, is based on the raw data-file. This means it can only be applied on all data at once:
▪Open the data-file you want to create segments for.
▪Click Transform - Events - Create coding segments ![]() .
.
▪Select the Classes for which the co-occurring patterns should be created.
▪Click OK to confirm your selection.
▪Confirm that you want to create those segments
INTERACT now runs through all Events that hold Codes of the selected Classes and creates a new data-file that contains the new segment based Events. Each Event represents a segment per co-occurring pattern. Per segment, all original Codes are entered as they occurred.
Aggregated Codes
Each segment now holds all Codes that were logged during that specific time frame. In order to get a statistical overview of all combinations, a new Class in which all Codes are combined is required.
That is why additionally, the Move & Combine Codes routine is run automatically over all Codes, resulting in a new Class called 'All Codes' - which contains the combined Codes per segment.
For statistics, you usually only need the 'All Codes' Class.
Note: This 'All Codes' Class is a sequential representation of your original, overlapping, codings and can thus be used for a Sequence Analysis over all Codes at once!
Remove Clutter
Due to even the slightest coding inaccuracies and the very precise time handling of this segmentation routine, your new data-file may hold a number of single frame segments that are the result of tiny overlaps that should not be there.
Delete Events Without Duration
As long as you did NOT log any Codes without duration in your original data, you can simply remove all single frame Events.
You can use the Search routine to select all Events without duration with a simple search:
▪Select ¤Timecode.
▪Select the option Mark all single point events.
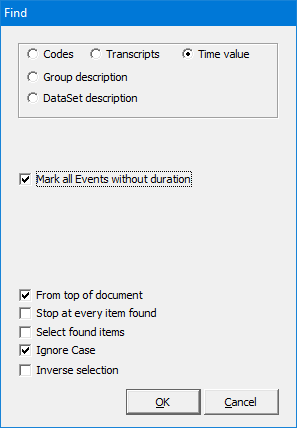
▪Confirm your search with OK.
Hide Events
If you still feel that there are a lot of unlikely and/or very short combinations present, you can hide those Events from the DataSet based statistics in two different way:
•Do not select those combinations while calling the Time Line Chart
•Remove only the occurrences based on their length from the Time Line Chart
Excluding Events based on their duration, from the Time Line Chart and therefore from the statistics, can be very helpful to clean up your statistics.
It means, that you can exclude extremely short or long Codes, without having to filter them using the Cluster data export. It works like this:
▪Open the Time Line Chart, by clinking Analysis - DataSet - Main Statistics ![]() .
.
▪Click on the Duration filter ![]() icon or choose Analysis - Filter events on time from the menu.
icon or choose Analysis - Filter events on time from the menu.
The filter Event on duration filter appears:
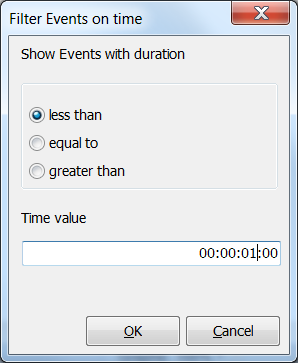
▪Select the constraint that fits the Events you want to exclude.
▪Enter the critical value for the duration, in time code format.
In this example all Events, with a length less than 1 second, are removed from the Time line chart.
▪Confirm with OK.
IMPORTANT: Re-applying the filter with a different value does NOT bring the already removed values back!
To regain a full view of all Events, you will to close the Time line chart window and start anew.
This makes it possible to subsequently apply multiple filters to the same data, allowing you to e.g. exclude all very short as well as all extremely long Events.
| TIP: | In combination with the Contingency analysis (e.g. to create latency Events to measure reactions), this functionality allows you to exclude extremely fast or very slow reactions from the statistics afterwards. |