To change the granularity of the interval, do as follows:
▪
▪Click the Settings ![]() icon, within the Time Line Chart window.
icon, within the Time Line Chart window.
▪Switch to the Grid tab.
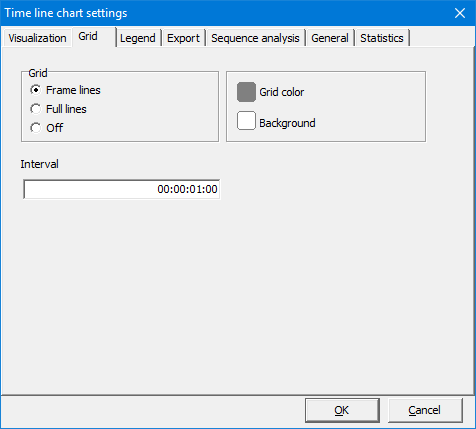
▪Enter the grid interval value into the text box Interval (every how many seconds and frames).
For frame accurate exports, set the interval to 00:00:00:01 or 00:00:00.040 (depending on your time value settings and the number of frames per second).
To analyze your data per second, enter 00:00:01:00 or 00:00:01.000.
To draw a grid line every 5 minutes, enter 00:05:00:00 or 00:05:00.000
IMPORTANT: The grid size, determines the interval width of the Time Line Chart. The chosen grid also influences the results of some statistics AND it influences the export of the Cluster data export, Export Data per Code and Export Data per Class routines.