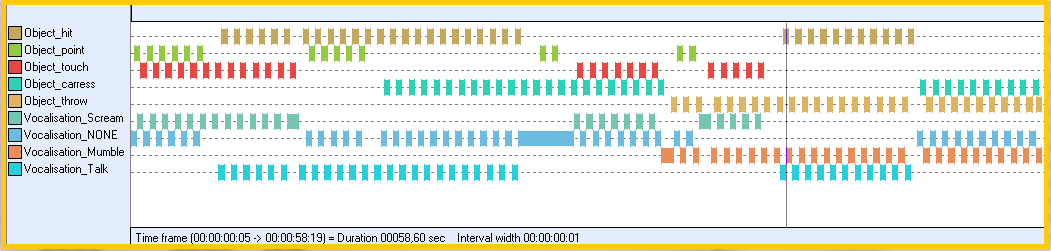
To export your Codes over time, split by Codes, the required functionality can be found in the Time Line Chart.
This analysis is a 100% frame accurate presentation of all your data logged.
Per time interval (free definable on a single frame base), you get a numerical matrix with values for "coded/not coded" for all Codes. The so exported data can be analyzed with other applications e.g. patterns of simultaneously occurring behavior (values in one line) or successive behavior (values across multiple lines). Also read Cluster data Export, Lag sequential analysis and p.a.t.t.e.r.n.
Note: This export routine can be used for all data, because each Class/Code combination results in a separate column.
Export data
▪Visualize the data to be exported in the Time Line Chart
Warning: If you have multiple DataSets that need to be looked at seperately, make sure you select only 1 DataSet when opening the Time Line Chart -because, for multiple DataSets, all time information is joined and looked at as if they where one!)
▪Open the TLC settings![]() dialog.
dialog.
▪Switch to the Grid tab.
▪Set the preferred Time interval
▪If needed, select Export time values on the Export tab.
▪Confirm those settings with OK.
▪Choose Analysis - Export data per codes from within the Time Line Chart window.
INTERACT generates a 0-1 MATRIX of your data (the resulting text file was imported into Excel and with the help of conditional formatting, the cell with a 1 have been highlighted):
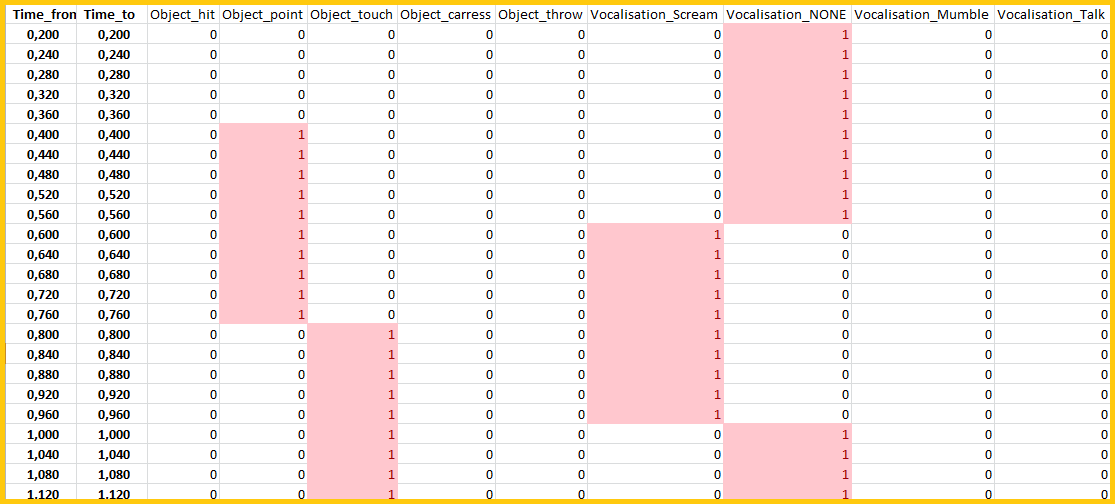
Every line (except the header) represents a time interval. How to adjust the interval width is explained in Interval granularity.
What information is included and in what form, needs to be specified in the Time Line Chart options on the Export tab as is described in Export values and settings.
NOTE: In exports with grids > 1 frame, Numerical values (from !Classes) are summarized per interval (e.g. number of eye-blinks per second within 10 second time intervals)
What happens?
Whenever a behavior covers more than the specified percentage of the interval, as set for the current Time Line Chart, INTERACT regards it as a 'coded value' (1) for that interval. Otherwise INTERACT interprets it as a 'missing value' (0) for that interval.
| TIP: | What value is used for "coded" and "not coded" intervals, can be defined individually, as described in the Export values and settings. Here you can also define to include time values or not and in what format. |
The resulting export file contains as many columns, as different Class/Code combinations are found in the current Time Line Chart window. For every visible interval you receive a data line. You can look at it, as the Time Line Chart with interval grid lines shown (options - grid - 'full lines'), turned 90 degrees clockwise.