IMPORTANT: The export routine Export data per Class is only to be used for mutual exclusive Codes per Class, because only one Code per Class and per Interval is exported.
If you want to export your Codes over time, split by Classes, this analysis offers a 100% frame accurate presentation of all your data logged.
The resulting text file contains a single line per time interval (free definable on a single frame base), the output of all Codes is split per Class in a textual matrix form.
The so exported data allows you to analyze your data with other programs, e.g. patterns of simultaneously occurring behavior (values in one line) or of successive behavior (values across multiple lines). Also read Cluster data export, Lag sequential analysis and p.a.t.t.e.r.n.
Export data
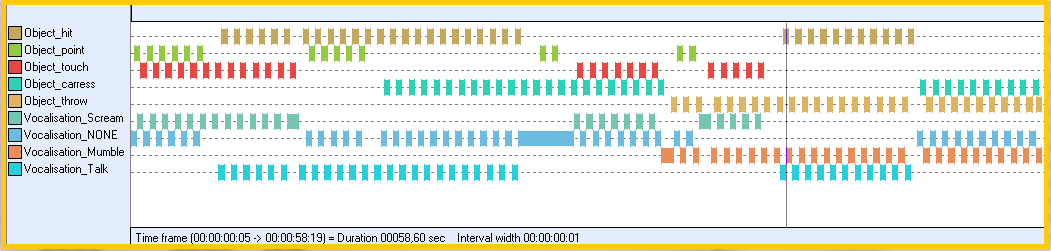
▪Visualize the data to be exported in the Time Line Chart
Warning: If you have multiple DataSets that need to be looked at seperately, make sure you select only 1 DataSet when opening the Time Line Chart -because, for multiple DataSets, all time information is joined and looked at as if they where one!)
▪Open the TLC settings![]() dialog.
dialog.
▪Switch to the Grid tab.
▪Set the preferred Time interval
▪If needed, select Export time values on the Export tab.
▪Confirm those settings with OK.
▪Choose Analysis - Export data per Class... from the menu in the Time Line Chart window.
▪Name and save the file to be created, using the upcoming default Save as dialog.
INTERACT creates a file containing data like this (the resulting text file was imported into Excel and with the help of conditional formatting, the cell with zeros have been highlighted):
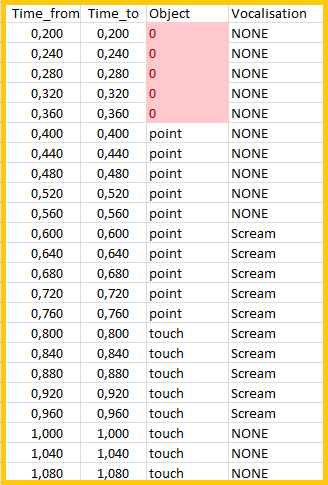
Every line (except the header) represents a time interval. How to adjust the interval width is explained in Interval granularity.
What information is included and in what form, needs to be specified in the Time Line Chart options on the Export tab as is described in Export values and settings.
What happens?
Whenever a behavior covers more than the specified percentage of the interval, as set for the current Time Line Chart, INTERACT regards it as a 'coded value' (1) for that interval. Otherwise INTERACT interprets it as a 'missing value' (0) for that interval.
| TIP: | What value is used for "coded" and "not coded" intervals, can be defined individually, as described in the Export values and settings. Here you can also define to include time values or not and in what format. |
Whenever a coded value is detected, this Code is exported the same way is it is written in the current document. INTERACT does not search any longer for a coded value within that Class in the current time interval. If, within one Class, more than one behavior is coded in a certain time interval, only the first Code found - within this time interval - is exported.
This output has about the same structure as your INTERACT document, whereas all data is sorted ascending by time and only fixed time intervals are "scanned".
Note: By varying the interval width and using the 50% rule, you can filter data frame accurate at any level. You can e.g. exclude all Events that last less that 2 seconds by setting the interval width to 4 seconds + 1 frame. This way all Events equal or less 2 seconds are always below the 50% limit of the scanned interval width.