Apart from the statistics available in the Time Line Chart, as is described in DataSet based Statistics, INTERACT offers statistics that show your results differently:
ocumulated over all selected DataSets
ogrouped per Class
Note: A complete statistical overview, of duration and frequencies for all Classes, accumulated over all selected DataSets, can be found in Class Report.
Frequency of occurrence
To get a pie chart, showing you the frequency based pattern of distribution of the selected Codes within one Class:
•Click Analysis - Class Statistics - Frequency Chart ![]() in the toolbar.
in the toolbar.
•Choose one Class from the now appearing Filter dialog.
•If your data-file contains more than one DataSet, select the required DataSet(s) from the Select DataSet dialog.
(If you select multiple DataSets, all values from the selected DataSets are cumulated)
The results are displayed in a chart like this:
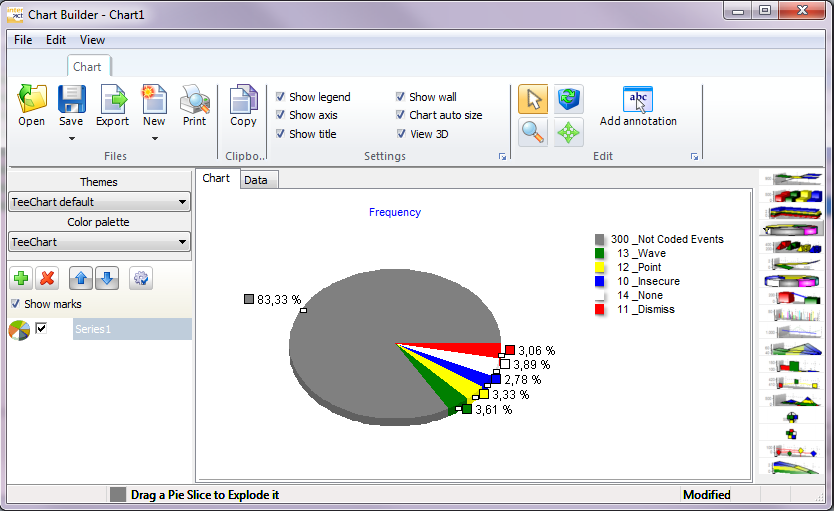
View the corresponding values on the Data tab; select the X-values and color check boxes if need be.
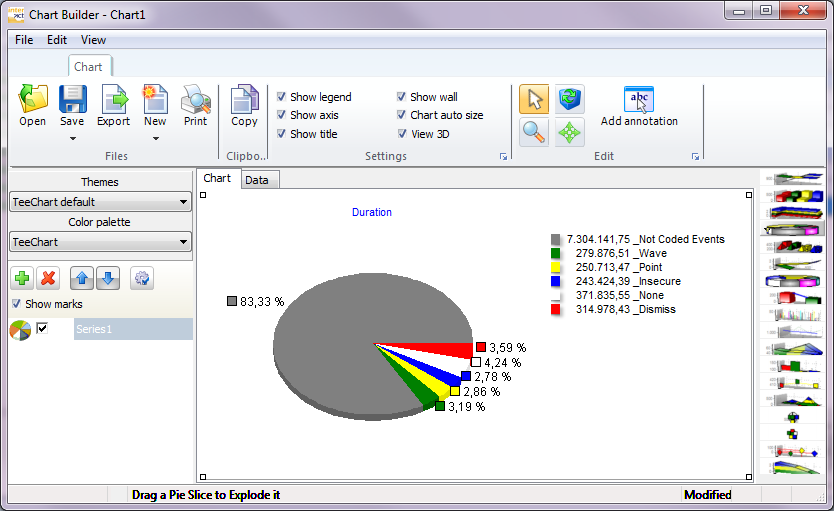
Duration
A pie chart, showing you the duration based pattern of distribution of the selected Codes within one Class:
•Click Analysis - Class Statistics - Duration Chart ![]() in the toolbar.
in the toolbar.
•Select one Class from the now appearing 'Select Class'-dialog.
•Confirm this selection by clicking 'OK'.
•If your data-file contains more than one DataSet, select the required DataSet(s) from the Select DataSet dialog.
(if you select multiple DataSets, all values from the selected DataSets are cumulated).
•Confirm with 'OK'.
INTERACT now creates a diagram, that looks something like this:
Coded versus not Coded
In the example pictures, you see an area that is labeled "Not coded".
This area, represents all Events of the selected DataSets, that do not contain a Code from the selected Class.
Depending on your personal preferences or the requirements for your study, you can select different calculation options within the Program settings dialog on the tab Calculation. You can even create a graph of only coded versus not coded data.
•For further details, read the topic Calculation settings.