INTERACT offers a broad range of descriptive statistics with just a few mouse-clicks.
Descriptive Statistics
IMPORTANT: To get an overview of all your observations at once, use one of the applicable merge routines to create one big compilation file. You might even discover that you need multiple versions of the same data do answer all your research questions. For this INTERACT offers a range of restructuring routines.
Even if your document contains data, that was logged in multiple sessions and is shown in a rather mixed up order, INTERACT has no problem showing your data chronologically.
Note: The most important tool, for descriptive DataSet based statistics, is the Time Line Chart.
All statistics, available in the Time Line Chart, are split per DataSet and listed per Code.
Accumulated results over multiple DataSets, grouped per Class are explained in the section Class based Statistics
▪Make sure you have opened a document containing behavioral data.
(To create demo data, select Open ![]() > Demos > Example file for multi-purpose analysis)
> Demos > Example file for multi-purpose analysis)
▪Click Analysis - DataSet - Main Statistics ![]() in the toolbar.
in the toolbar.
▪Select the Classes (or single Codes) you are interested in.
▪Confirm with OK.
▪If you have more than one DataSet, select the DataSets you are currently interested in.
▪Confirm with OK.
For further details about the different selection methods, read Data Selection - Codes & Classes and Data Selection - DataSets.
The Time Line Chart window appears, showing all selected Codes of all selected DataSets on a chronological time line, like this:
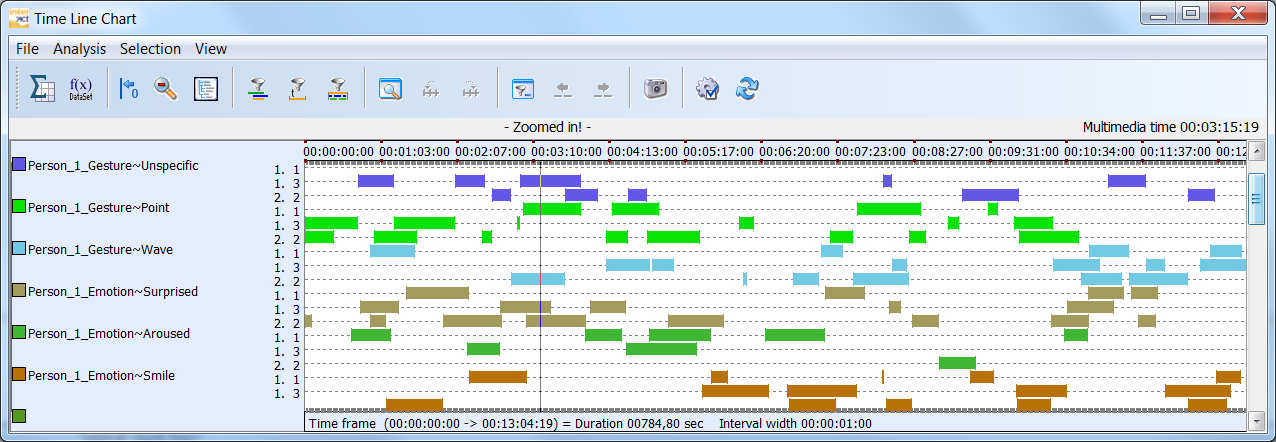
The numbers in the legend (1.1, 1.2, 1.3 etc.), stand for DataGroup.DataSet as listed in your data-file. In this example, we selected DataSet 1 and 3 from DataGroup 1, as well as DataSet 2 from DataGroup 2.
All Codes are displayed in bars, indicating the length for each period a Code was logged.
▪Zoom into your data, by dragging your mouse over the Events, selecting only a part of the data (or press ALT and use the scroll wheel of your mouse).
IMPORTANT: The statistics, exports and analysis routines available within the Time Line Chart, always reflect the data currently visible in the Time Line Chart. If e.g. you are ‘zoomed in' on just a part of your data, only this part is taken into account.
This means, that you can restrict your data even further, by running one of the available Filter routines. Those filter routines, virtually remove Events from this view, just like zooming in on your data at a specific time interval does.
Details on those additional data restrictions, can be found in Find overlapping Events as well as the sections DataSet based Filters & Views and DataSet based Statistics & Exports .
TIP:The visualization of your data can be adapted in the Time Line Chart Options![]() . These and many other settings, are explained in Time Line Chart options.
. These and many other settings, are explained in Time Line Chart options.
▪To get a wide range of statistical figures per DataSet, click ![]() or choose Analysis - Statistics per DataSet from the Time Line Chart menu, :
or choose Analysis - Statistics per DataSet from the Time Line Chart menu, :
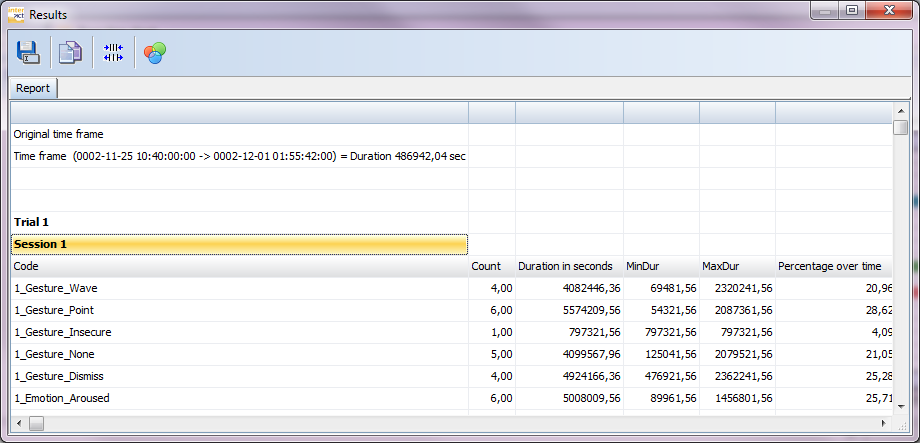
All Codes are listed per DataSet, showing all descriptive statistical values at a glance.
▪To get basically the same data, but in another perspective AND with the possibility to visualize each of the statistical values in numerous ways, click ![]() or choose Analysis - Full statistics:
or choose Analysis - Full statistics:
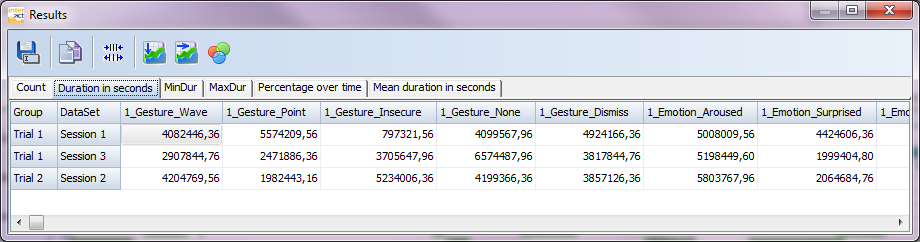
The Full Statistics Results, lists your data as a single row per DataSet and a column for each Class_Code combination*. The different values are available on separate tabs.
This structure is easy to transfer to SPSS or MS Excel - just use the Copy button to transfer your data.
*) If you want to display Codes that have not been coded within the current document, use the Time Line Chart Option![]() Statistic - Show all Classes/Codes of current Code-Archive option.
Statistic - Show all Classes/Codes of current Code-Archive option.
Visual Data Exploration
INTERACT offers a special visual data exploration routine, which is active per default:
▪The icon Visual Data Exploration ![]() in the toolbar, allows you (de)activate this functionality.
in the toolbar, allows you (de)activate this functionality.
All results are analyzed and colored like this:
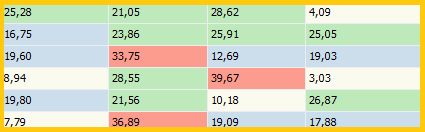
All values are compared and the range, between the lowest and highest value, is used to split the results into four groups:
•Beige is used for the values within the lowest 25%
•Blue is used for the values within the next 25%
•Green is used for the values within the third 25%
•Red is used for the values within the highest 25%
This gives you immediate feedback on your results.
More DataSet based Analysis Routines
Additional analysis routines available from within the Time Line Chart, not all of them are described in the User guide:
•Co-occurrence Filter, to find overlaps for a specific combination of Codes
•Trim on Code Filter, to find all overlaps for a single Code
•Sequential analysis, to analyze how often each Code is followed by other Codes
•Duration Filter, to virtually remove certain Events based on their duration
•Export Data per Code, to create an interval based export for all Class_Code combinations
•Export Data per Class, to create an interval based export for Classes with mutually exclusive Codes
•Cluster Data Export, to build interval based clusters
•Define Time based Intervals, to display your data per fixed interval
•Define Code based Intervals, to display all co-occurrences per occurrence of the selected Code
Note: To learn more about these powerful routines, visualization options, and settings that are offered by this Time Line Chart and its included statistics & export routines, also read the sections Time line based statistics & export and Time line based visualization .