This functionality allows you to get the statistics on e.g. the first 30 seconds of your session!
IMPORTANT: If you store multiple sessions within the same file, using separate DataSets for each session, those DataSets might not start at the same time.
This makes comparing the first so many seconds difficult.
To solve that, you can synchronize all DataSets in different ways.
Take a look at the various possibilities to virtually shift DataSets in time, as described in Move DataSets virtually in time, so you can compare them on a time line.
Set Interval
The required time frame can be set like this:
▪Click Analysis - Evaluation - Timeline Chart ![]() to create a Timeline Chart.
to create a Timeline Chart.
▪Click the Select interval ![]() icon, in the Timeline Chart toolbar.
icon, in the Timeline Chart toolbar.
The upcoming 'Select time window' dialog enables you to define a precise interval or you can enter a specific start and end time manually:
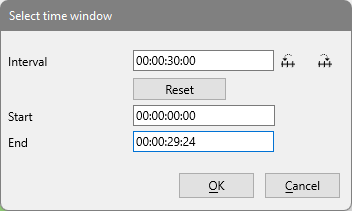
▪Enter the required interval into the Interval text field.
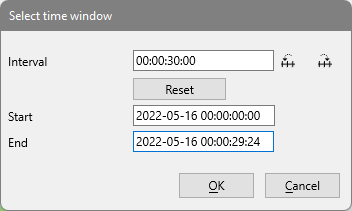
▪If you logged your Events including a date, enter that start date into the field Start.
The two buttons, on the right of the Interval field, help you enter the exact start and end time of the Next interval ![]() or Previous interval
or Previous interval ![]() - based on the interval length entered in the Interval field.
- based on the interval length entered in the Interval field.
IMPORTANT: If you logged your Events including a date, enter your start date into the Start text box, in front of the time value before you click the Next interval ![]() button!
button!
In this example an interval of 30 seconds has been defined.
▪One click on the Next interval ![]() button enters the correct start and end time of this interval.
button enters the correct start and end time of this interval.
▪Click OK to confirm your settings.
The Timeline Chart now shows only data of those first 30 seconds.
▪Use the Next interval ![]() and Previous interval
and Previous interval ![]() buttons within the Timeline Chart window to view each interval at a time.
buttons within the Timeline Chart window to view each interval at a time.
IMPORTANT: The statistics, exports and analysis routines available within the Timeline Chart, always reflect the data currently visible in the Timeline Chart.
If e.g. you are ‘zoomed-in' on just a part of your data, only this part is taken into account in the statistics results.