This routine inside the Timeline Chart is sort of a combination of the Trim on Code filter and the Time-based Interval routines:
It allows you to use a specific Code from a specific DataSet to create a dynamic time interval. This allows you to analyze your Codes, per occurrence of the selected Code.
This means that, instead of extracting all Codes that where coded while e.g. the Code 'Eyes closed' was coded (as the Trim on Code filter allows you to do), you can analyze exactly what happens during each occurrence of the selected Code 'Eyes closed'.
This works best for one DataSet at the time, unless the Events from one DataSet match the required periods for all Events.
IMPORTANT: This functionality is only useful if you need a graphical representation for one or more occurrences of your 'Interval-code' and the behavior that occurs during this period, or if your 'Interval-Code' is only available in a single, separate DataSet and not within each Set separately.
| TIP: | Use the Code-based Interval Statistics routine instead, to get all values for all intervals (occurrences of the selected code) at once. |
Interval Definition
The interval is a physical one, as available on the Timeline, and needs to be identical for all DataSets:
▪Click Analysis - Evaluation - Timeline Chart ![]() to create a Timeline Chart.
to create a Timeline Chart.
▪Within the TLC toolbar, click Select Code for intervals ![]() .
.
▪Select the appropriate Class and Code from the upcoming dialog:
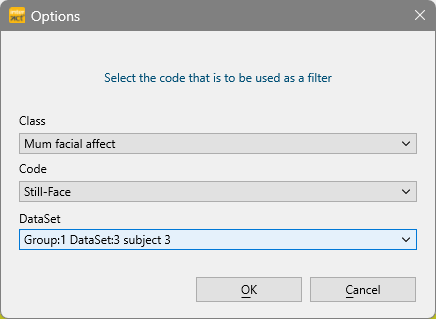
Note: The moment you have selected multiple DataSets for your Timeline Chart, you also need to pick the DataSet that hold the selected Interval-Events that are to be used for your interval!
▪Confirm your selection with OK.
The Timeline Chart now zooms in on the first occurrence of the selected Code, showing only this part of the data!
IMPORTANT: The statistics, exports and analysis routines available within the Timeline Chart, always reflect the data currently visible in the Timeline Chart.
If e.g. you are ‘zoomed-in' on just a part of your data, only this part is taken into account in the statistics results.
Results per Interval
The most interesting statistical values are the percentage of time per Code per Event, as well as the exact number of co-occurring Codes and their duration:
▪Click ![]() or choose Statistics per code from the Analysis menu.
or choose Statistics per code from the Analysis menu.
▪Click on the, now available, Next code interval ![]() icon, to view the data that corresponds with the next occurrence of the selected Code.
icon, to view the data that corresponds with the next occurrence of the selected Code.
The TLC 'jumps' through time, until it finds the next occurrence (=Event) of the selected Code and again displays just this part of your data.
As always, the statistics only reflect the currently visible data.
▪Click on the Previous code interval ![]() icon, to move back through your data.
icon, to move back through your data.
▪Click on the Zoom out icon ![]() to return to a full view.
to return to a full view.
Results for all Intervals
Since INTERACT 20 the Code-based Interval Statistics provides you with the numbers for all occurrences of the selected Code in a single report.