When visualizing your Observation Codes with the Timeline Chart, INTERACT enables you to zoom in on any interesting part. If you notice a peculiar pattern, you can take a closer look, by zooming in on just that part of the chart:
Note: The main advantage of this functionality is that this 'zoomed view' is also reflected in the statistics!
(Read more about those statistics in DataSet-based Statistics)
Zoom on Mouse Position
▪Right-click and drag your mouse inside the time-bar underneath the menu icons, to zoom in around the time you clicked into the time-bar.

| TIPP: | Move your mouse with the right mouse-button pressed, to move the displayed area. |
Select 'zoom-area'
▪Click with your mouse in the chart at the start of the interesting part.
(Notice the time, shown in the upper right corner. This is the exact position of your mouse on the time scale)
▪Hold down your mouse and move it to where the interesting part ends.
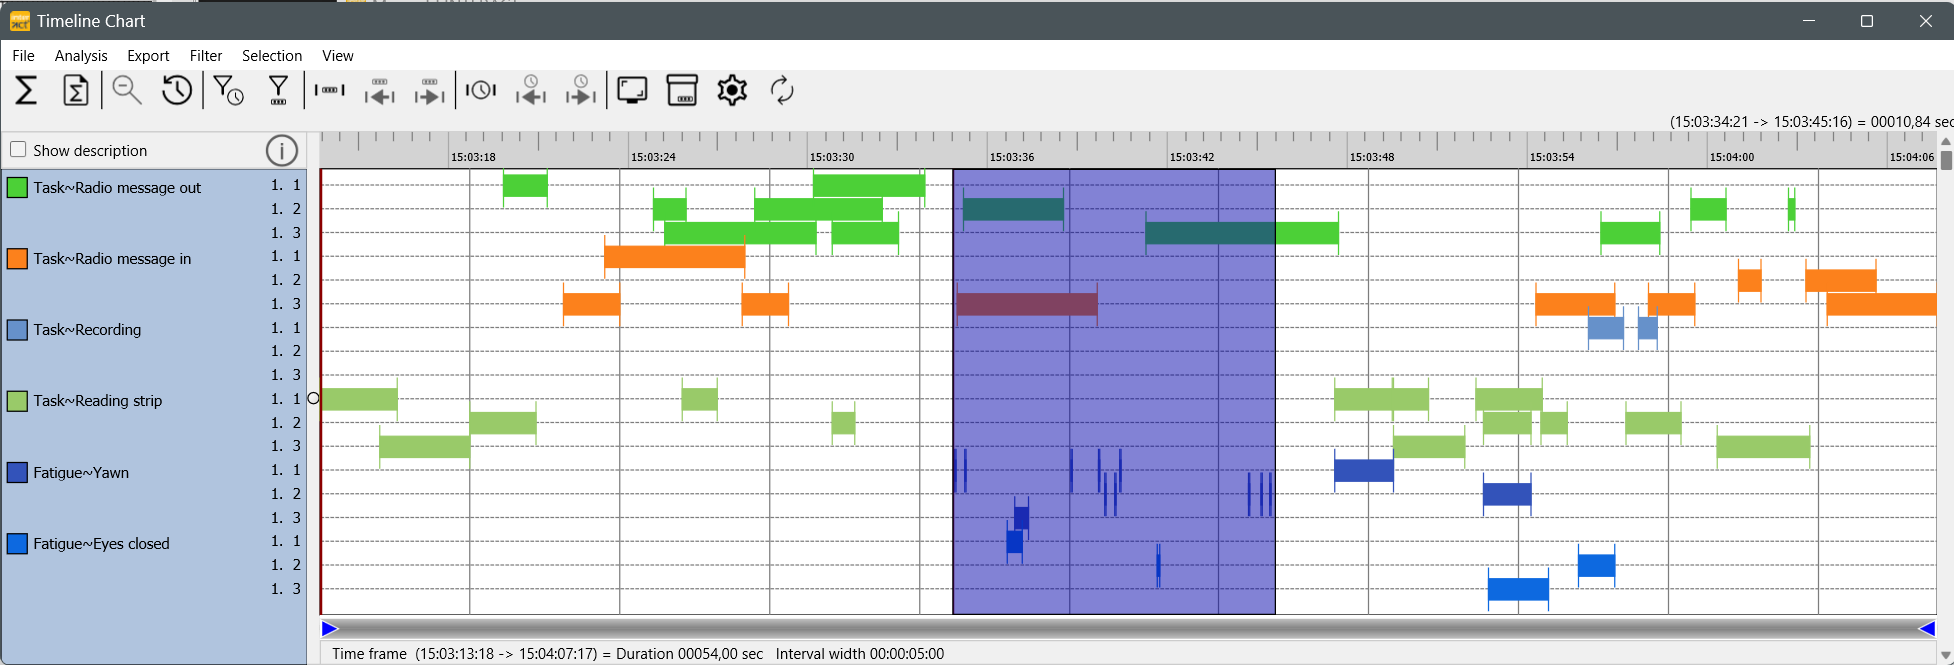
As soon as you release your mouse, the Timeline Chart zooms in and displays only the selected part of your chart:
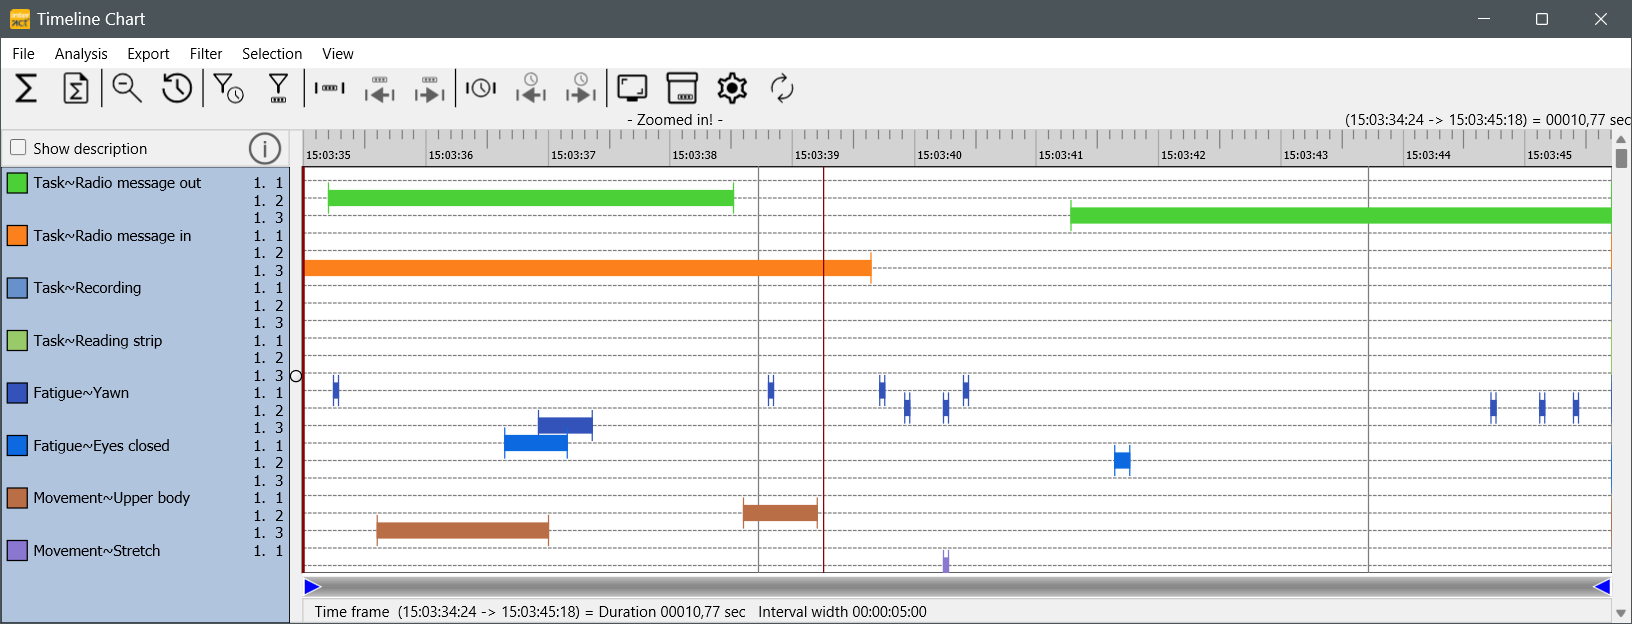
Additionally, a message - Zoomed in - appears above the time line and the time frame covered by the selected part, is listed at the bottom of the window.
▪To return to the original view of your chart, click the zoom out ![]() button.
button.
Note: A far more precise way of defining a zoom area is also available: The two possible approaches are described in Time-based Interval Selection and Code-based Interval Selection.