Dies ist eine der wichtigsten Einstellungen innerhalb des Zeitdiagramms, weil dadurch auch die Interval-basierte Exporte beinflusst werden.You can influence how your Codes bars are displayed in the Timeline Chart window right here:
▪Click Timeline Chart Settings ![]() .
.
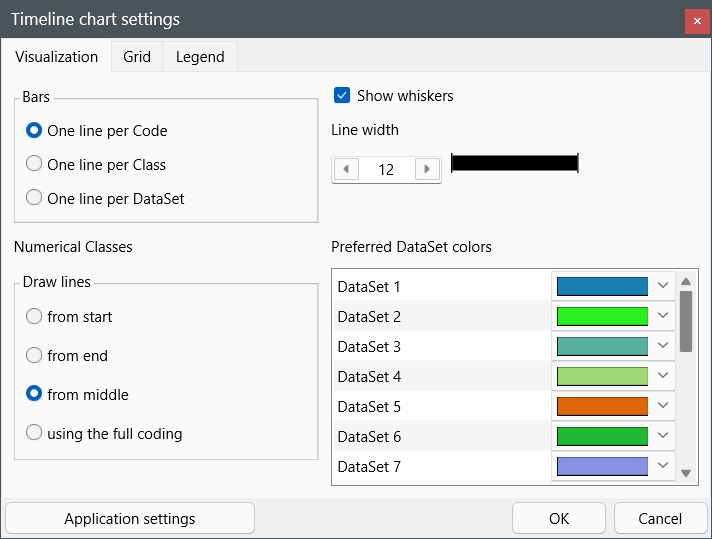
▪Switch to the Visualization tab.
Observation Codes
Bars
oOne line per Code - Displays Codes and Classes with a single line for each Code separately. The available Class~Code combinations are listed in the legend on the left side of the graph. The Observation Codes are split by DataSet, the DataSet number is listed in front of each row.
oOne line per Class - Accumulates all Codes per Class into one line. The Classes are shown in the legend on the left. Every Code has its own color. This presentation is only useful when working with mutual excluding Codes per Class. Open the Code Archive to get the color legend for your Codes.
oOne line per DataSet - Shows all Codes and Classes of a DataSet in a single line. Only the DataSet numbers are listed on the left side of the graph. Every Class~Code combination has its own color (good for mutual exclusive Codes per DataSet).
Open the Code Archive to get the color legend for your Codes.
| TIP: | Double-click the legend or click the Code Archive |
Line width
Use the Line width slider to change the strength of the bars in the Timeline chart.
| TIP: | To change the line width accurately, click on the scroll bar and use the ARROW RIGHT and ARROW LEFT keys on your keyboard! |
Numeric Classes
If you use any numeric and/or numeral !Classes, the Timeline Chart displays them as a diagram (line chart). If those Codes are recorded with duration, you need to decide at what point of time the Code is drawn. Standard the lines are drawn from the middle of the duration of each Code.
oDraw lines...from start - Draws the graph lines from the start time of one Event to the start time of the next Event.
oDraw lines...from end - Draws the graph lines from the end time of one Event to end time of the next Event.
oDraw lines...from middle - Draws the graph lines from and to the center of successive Events. This is the default and recommended setting.
oUsing the full coding - The diagram is drawn, following the complete length of each Event, resulting in a stair wise graph.
Preferred DataSet Color
When displaying numerical values, each DataSet is draw in a different color. What colors are used is specified here. The colors can be specified per subsequent Set.
This setting in NOT stored for the current document but applied to each file, using the subsequent Set numbers as loaded in the Timeline Chart.