This is one of the most important settings within the time chart, because it also affects the interval-based exports.
▪Click the Settings ![]() icon, within the Timeline Chart window.
icon, within the Timeline Chart window.
▪Switch to the Grid tab.
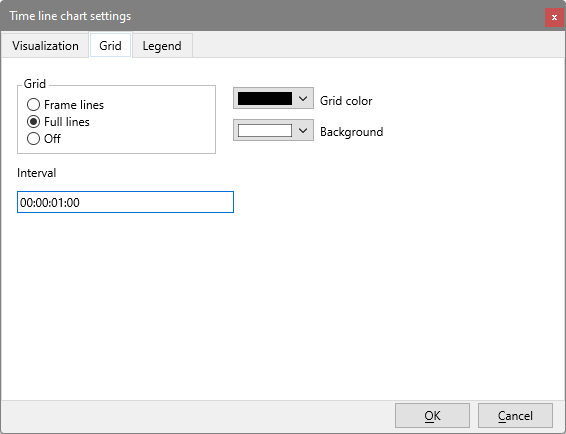
▪Enter the grid interval value into the text box Interval (every how many seconds and frames).
- To analyze your data per second, enter 00:00:01:00 or 00:00:01.000.
- To draw a grid line every 5 minutes, enter 00:05:00:00 or 00:05:00.000
- For frame accurate exports, set the interval to 00:00:00:01 or 00:00:00.040 (depending on your time value settings and the number of frames per second).
IMPORTANT: The grid size, determines the interval width of the Timeline Chart.
The chosen grid also influences the results of the export of the Cluster data export, Export Data per Code and Export Data per Class routines.
Grid
The Grid value specifies the distance at which grid lines are drawn in the Timeline Chart.
This Grid value is also used as the interval-width for some Interval-based Export routines.
▪Select how the grid lines should be shown:
•Frame lines - Small lines at the window frame
•Full line - Drawn from top to bottom in your chart.
•Off - To not shown them at all.
Note: Grid lines are not draw if they are too close together. What is too close depends on the total time frame that needs to be displayed.
Grid and Background Color
You can change the color of both the grid lines as well as the chart background:
▪Click on the color-drop-down menu to open the color picker:
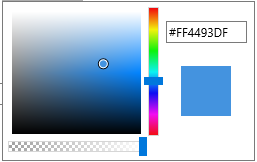
▪Drag the slider in the vertical bar to chance the color base.
▪Click inside the large square to select the intensity of the color of your choice.
The solid colored square shows a preview of the selected color.