Example: Presume you are doing a live observation of 5 gorillas and you want to log their activities:
- Where are they ("Area")?
- Do they have a toy?
- What are they doing?
Some activities stand on their own, but for the activities 'licking' and 'delousing' they do need a partner.
For our example we need three Code definition files:
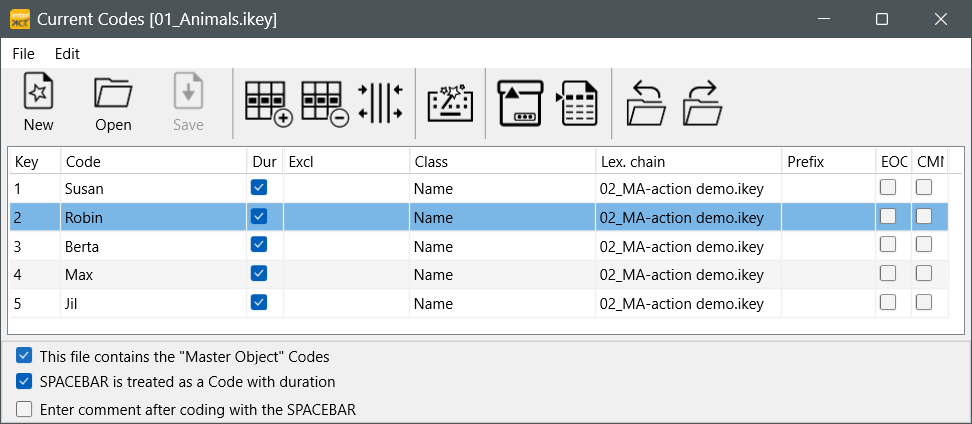
▪Define the top-level Code file, containing the names of the animals.
To identify this top-level Code definition file as the 'Master' file (ensuring that we can log Events in parallel for each animal),
▪Select This file defines the Master objects, at the bottom of the window.
▪Enter the name of the second-level file into the column Lex.chain.
The second file contains our various Codes with their corresponding Classes.
▪Click New to define a second-level file l
▪Enter your Code like the ones below:
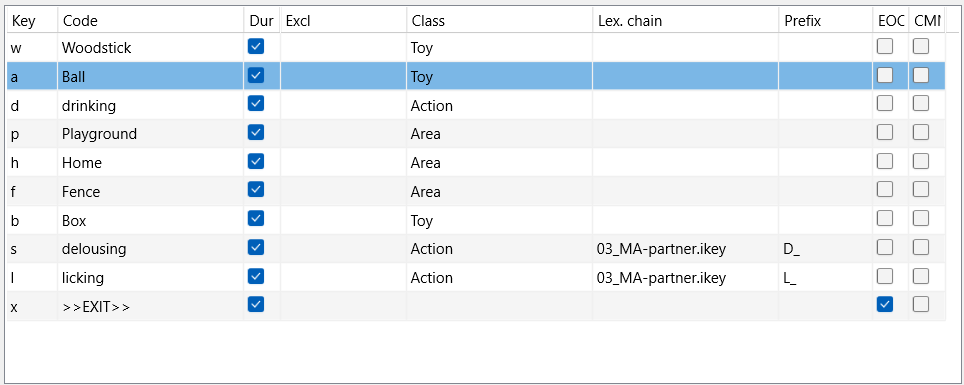
▪Save this second file under the name used in the Lex.Chain column of the top-level file.
To specify a partner, we need a third level of Codes:
▪Enter the name of a third file in the Lex.chain column, but ONLY for the Codes that require a partner.
In order to identify the kind of partnership at a glance, we want to log the names of the partner in two separate columns:
•one for the licking partner
•one for the delousing partner names
That is why we added a 'Prefix' for those two Codes.
▪Enter a Prefix, to split the partners (on the third level) into context based Classes.
▪Save the changes in this second file.
▪Define a third set, containing the names again, but this time without the Master-objects check box selected.
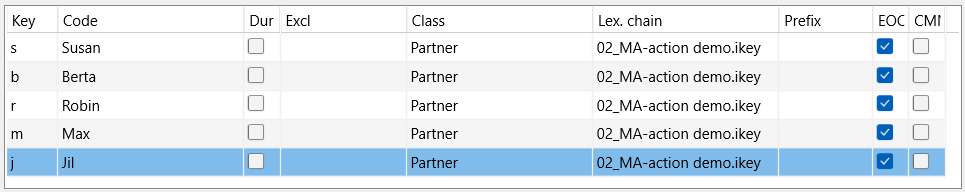
▪Make sure you use another Class name as in the top-level file!
▪Select the End Of Chain (EOC) option for each name, to ensures, that the 'Master' Code file is loaded automatically - after a partner name has been logged.
▪Save this third level partner file, using the name entered into the Lex.Chain column of the second-level file.
Logging Events
▪Click Start - Observation - Observation settings ![]() and select the Coding mode Complex.
and select the Coding mode Complex.
▪Make sure the top-level 'Master' Code definition file is loaded.
▪Click ![]() , to activate the Observation Mode.
, to activate the Observation Mode.
▪Click the first animal and specify position, possession and activity.
▪Repeat those steps for each animal.
▪The moment the situation changes for an animal, clicks its name again and specify the new situation.
After logging some Events, your document looks something like this:
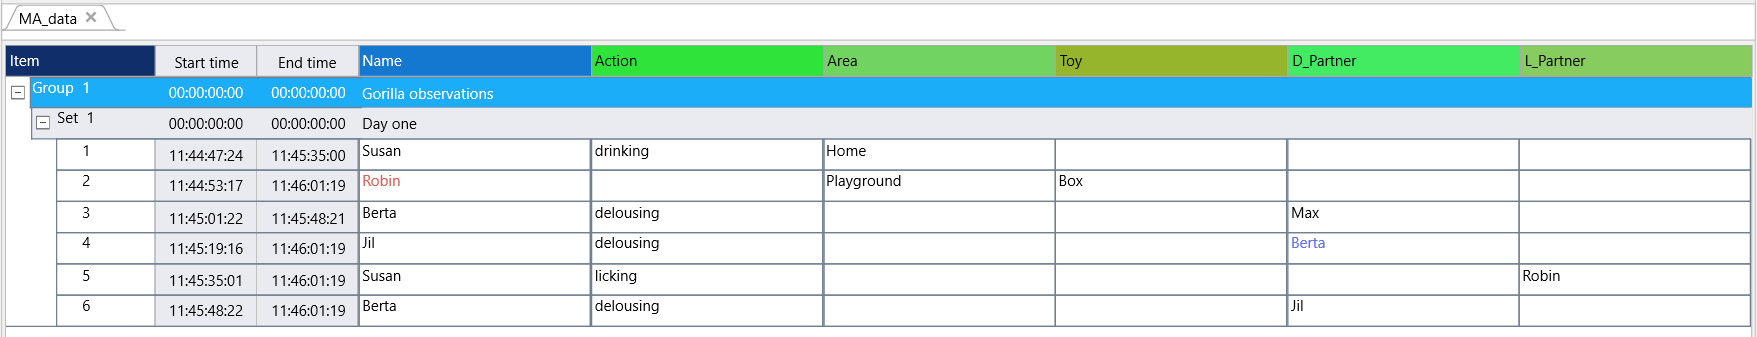
As you can see, the last two Classes have been created automatically, combining the 'Prefix' from the second-level file with the name of the Class of the third file.
Statistics
Data structured like this, does not give you the expected results (yet) in the INTERACT statistics: All codes are grouped by Class and not per subject Code.
To get usable statistics for subject based comparison, you have multiple scenarios to choose from:
| State-Space-Grid - For lexical coded Events, this routine can visualize certain relationships between two Classes. |
▪Click Analysis - Dyadic - State-Space-Grid ![]() to start this routine.
to start this routine.
Further details on this feature can be found in State-Space-Grid.
| Combine Codes - The fastest and simplest way to get frequencies and durations per Subject, is by combining the Codes per Event into a new combined Code. With this method, you have the statistics of the activities independent of the subject as well as the results per subject AND you are able to search for co-occurrences. |
▪Click Transform - Codes - Move and combine.
▪Select all Classes to get a complete combination.
▪Enter a name for your Target Class (or select an available class)
▪Confirm with OK.
| Split Data - If you want to compare the subjects individually, for instance how they reacted to a test, but do not want to search for co-occurrences between subjects, you better split your data into separate Sets per subject: |
▪Click on the column header "Name"
▪Click Edit - Sort - By Code Ascending ![]() * .
* .
▪Scroll down to the second name
▪Select the first line of the second name.
▪Click Insert - Restructure - Insert DataSet ![]() *.
*.
▪Scroll down to the next name and again select the first line containing this third name
▪Repeat the Insert DataSet command.
▪Repeat those steps until each subject is grouped in a separate DataSet.
*) Those commands are also available in the shortcut menu that appears after a right-click.
| TIP: | Enter the name of each subject into the corresponding DataSet description line, so you are able to easily identify each DataSet in the selection dialog, when creating a TLC for specific DataSets. |
Now you can use the Timeline Chart statistics on your data.
| Use MS Excel - MS Excel offers a great pivot table functionality, which allows you to make various data groups. If you are familiar with this, it is a great and easy way to get your frequencies (for duration based figures it is better to export the data from INTERACT instead of copying it). |
▪Select all Events in your INTERACT document (just the Events, NO DataSets) and copy them.
▪Paste the INTERACT data into MS Excel
▪Create a pivot table based on this data and arrange your headers and columns to your liking.
Note: Alternatively, consider collecting your data using the Prefix column to create separate activity columns per subject, like we did for the partner. A detailed description is found in the example Observe multiple persons.