If you combine the functionality of the Timeline Chart, the standard copy and past functions of Windows and an office program like Word or Excel, you can create a report with about 4 mouse clicks!
▪Create a Timeline Chart with the data you need in your report.
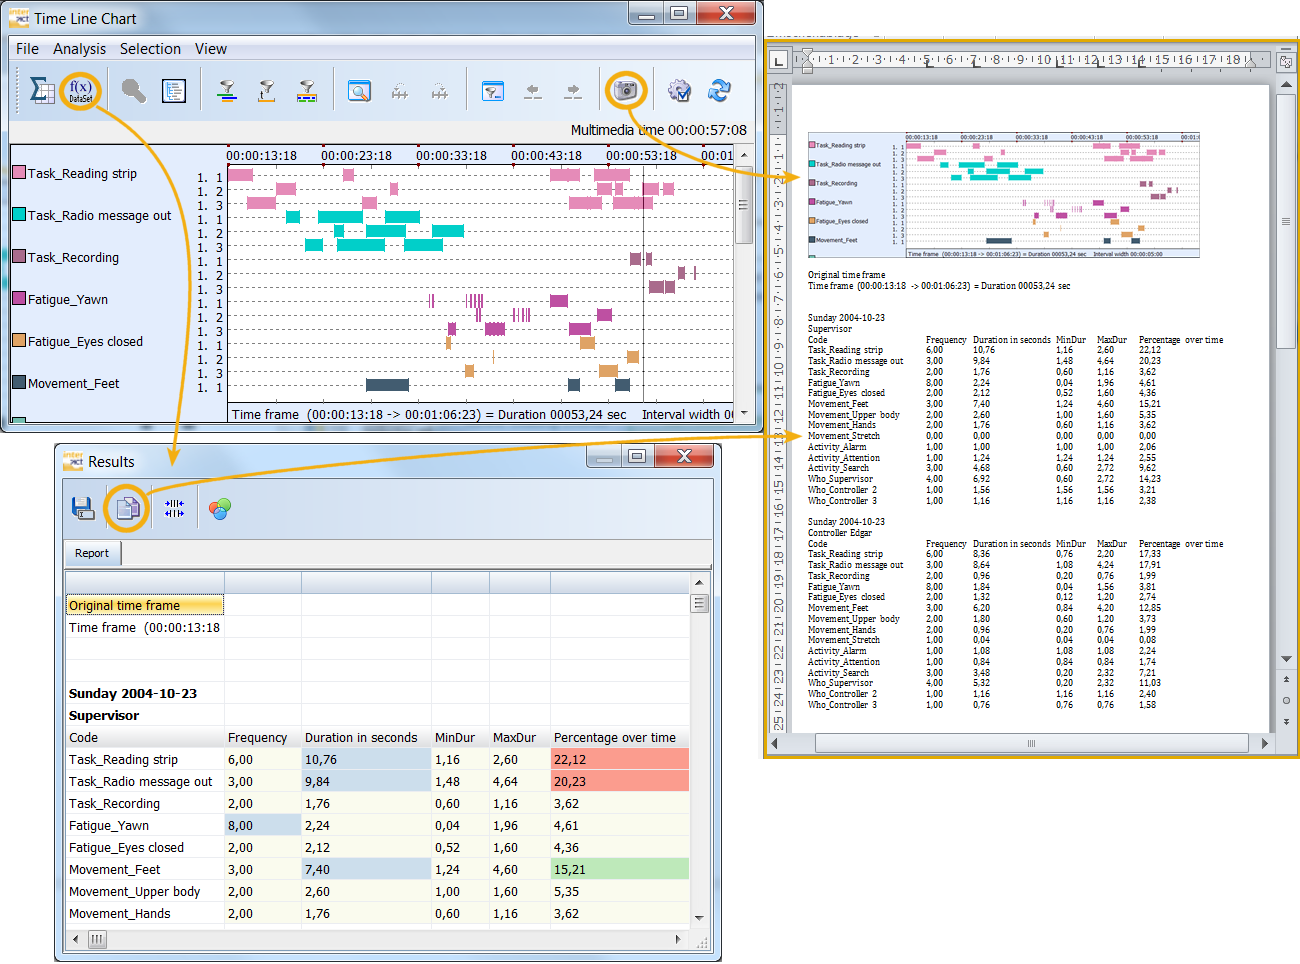
▪Click on the  icon in the Timeline Chart window to make a screen shot of this graph.
▪Create a new word document (or open an existing one).
▪Click in the target document and choose Edit - paste from the menu or use the standard shortcut CTRL+V.
▪Choose Analysis - Statistics per DataSet ![]() (or Analysis - Full statistics
(or Analysis - Full statistics ![]() ), from the menu within the Timeline Chart window or click on the corresponding buttons.
), from the menu within the Timeline Chart window or click on the corresponding buttons.
▪Click on the Copy button![]() in the 'Results' window.
in the 'Results' window.
▪Click in your target document and choose Edit - paste from the menu or use the default shortcut CTRL+V.
Note: All values are inserted as tab separated text. This means that in Word you need to adjust the tab stops to make it all fit.
•