The Timeline Chart offers great possibilities to visualize your data and to perform various statistical calculations. Before any data can be visualized, it has to be available within an INTERACT document.
This section describes the 'Timeline Chart' window, its icons and the various (layout) possibilities that can be altered, once the chart is created.
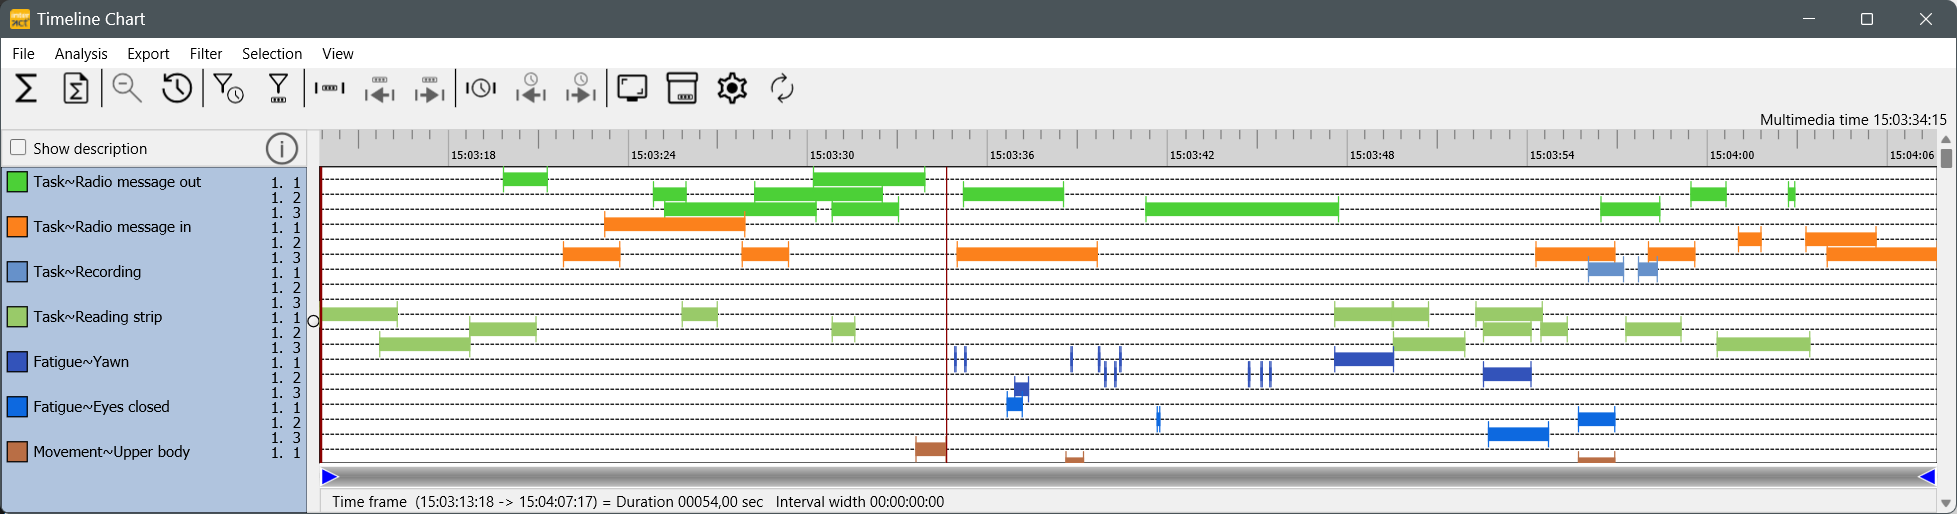
A Timeline Chart window looks something like this:
Timeline Chart Highlights
oThe Timeline Chart offers instant statistics and export routines, all based on the data that is currently visible!
oAll coded Events are always displayed chronologically.
oMoving your mouse over the Codes provides the video time information in the upper right corner.
oEach selected DataSet is displayed in a separate line per Code.
oBy cleverly using and combing the possibilities of the various filters as well as the zoom functionalities, you gain access to a variation of statistical reports and export possibilities.
Available icons
|
Full statistics - Opens the Full statistics result dialog, showing you figure based statics on your data. Read the section Full statistics for details. |
|
DataSet based statistics - Opens the statistic results dialog with an overview of various statistics per DataSet. Read DataSet statistics for details. |
|
Align on zero - If you make use of the Sync On Code routine, to virtually align you data on a specific Code, this command is vital to get the right statistics. One click hides all Events that virtually occur before zero. |
|
Zoom out - Only available if not all selected data is visible. Returns the view of your data to its original size. Read the section Zoom in on your data to learn how to use this powerful feature. |
|
Open Code Archive - Opens the Code Archive editor, in which you can re-arrange the order of your Codes and Classes, change abbreviations and colors. |
|
Duration filter - This filter allows you to virtually remove codes from the Timeline Chart based on their duration. Read Duration filter for details. |
|
Trim on Code filter - This filter allows you to identify all codes that where coded during the same time intervals whenever a specific Code was coded. Read the topic Trim on code filter for details. |
|
Time based interval - Enables you pre-define an exact time window (or interval) to be visualized in the Timeline Chart. Very useful if you want the statistics on only part of your data! Read Time based Interval Selection for details. |
|
Previous time interval - Only available if an interval has been defined in the Time window dialog. |
|
Next time interval - Only available if an interval has been defined in the Time window dialog. This button enables you to 'jump' through your data in identical steps, all with the exact same duration. |
|
Code based interval - This is a combination of the Trim on Code filter and the Time based interval functionality. It allows you to use a specific code from a specific DataSet to create a dynamic time interval, in order to analyze you Codes per occurrence of the selected code. Read Code based Interval Selection for details. |
|
Previous interval - Only active if a code has been selected in for the Code based interval functionality. |
|
Next interval - Only active if a code has been selected in for the Code based interval functionality; it allows you to jump to the next occurrence of the selected code. |
|
Snap shot chart - Copies the content of the TLC window, enabling to simply copy & paste the chart into another application. |
|
Options - Opens the TLC Options dialog, offering you a wide range of visualization and statistics options. Read Timeline Chart options for details. |
|
Refresh - Click this icon to make a redraw of the chart. This is sometime necessary after altering some of the options. |
DataSet Borders
The Timeline Chart can only display behavioral data within the time boundaries of a DataSet. Therefor INTERACT automatically adjusts the start- and end time code of each DataSet, to fit all behavioral Events.
If you want to use manually defined DataSet time borders, read the section Fixed DataSet Duration for details.