IMPORTANT: Available in INTERACT Premium only.
This great way of visualizing sequences and probabilities is based on Python functionality.
▪Select Analysis - Advanced - Visualization > Lag sequential analysis Sankey/Chord Diagram from the menu.
▪Select a suitable combination of Codes (read Lag Sequential Analysis for details)
▪Select the DataSets that should be included in the sequential analysis routine.
▪Confirm the lag sequential analysis settings that appear.
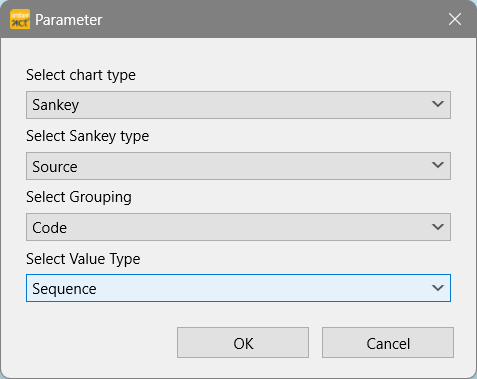
▪Confirm of adjust the specifies for the chart to be created:
The resulting diagram is displayed in a default browser window.
Per default, it shows the sequences between all selected Codes, like this:
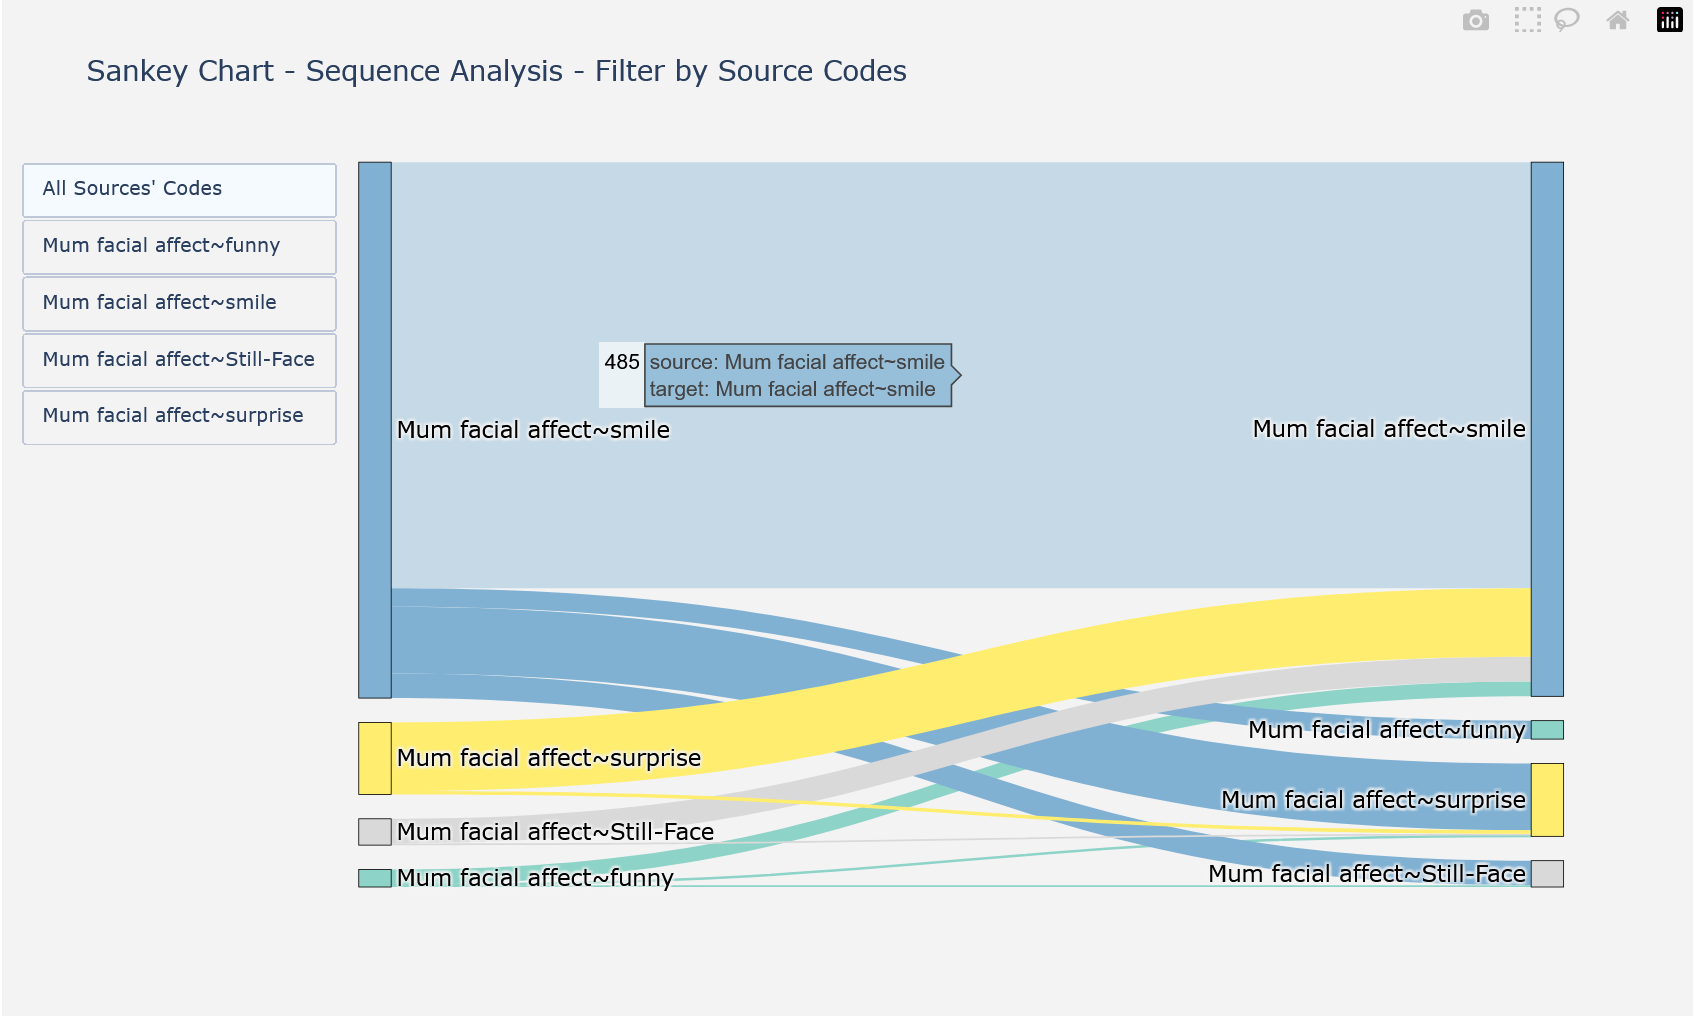
To see only the sequences following a specific Code, select that Code among the listed Codes at the far left.
Display values
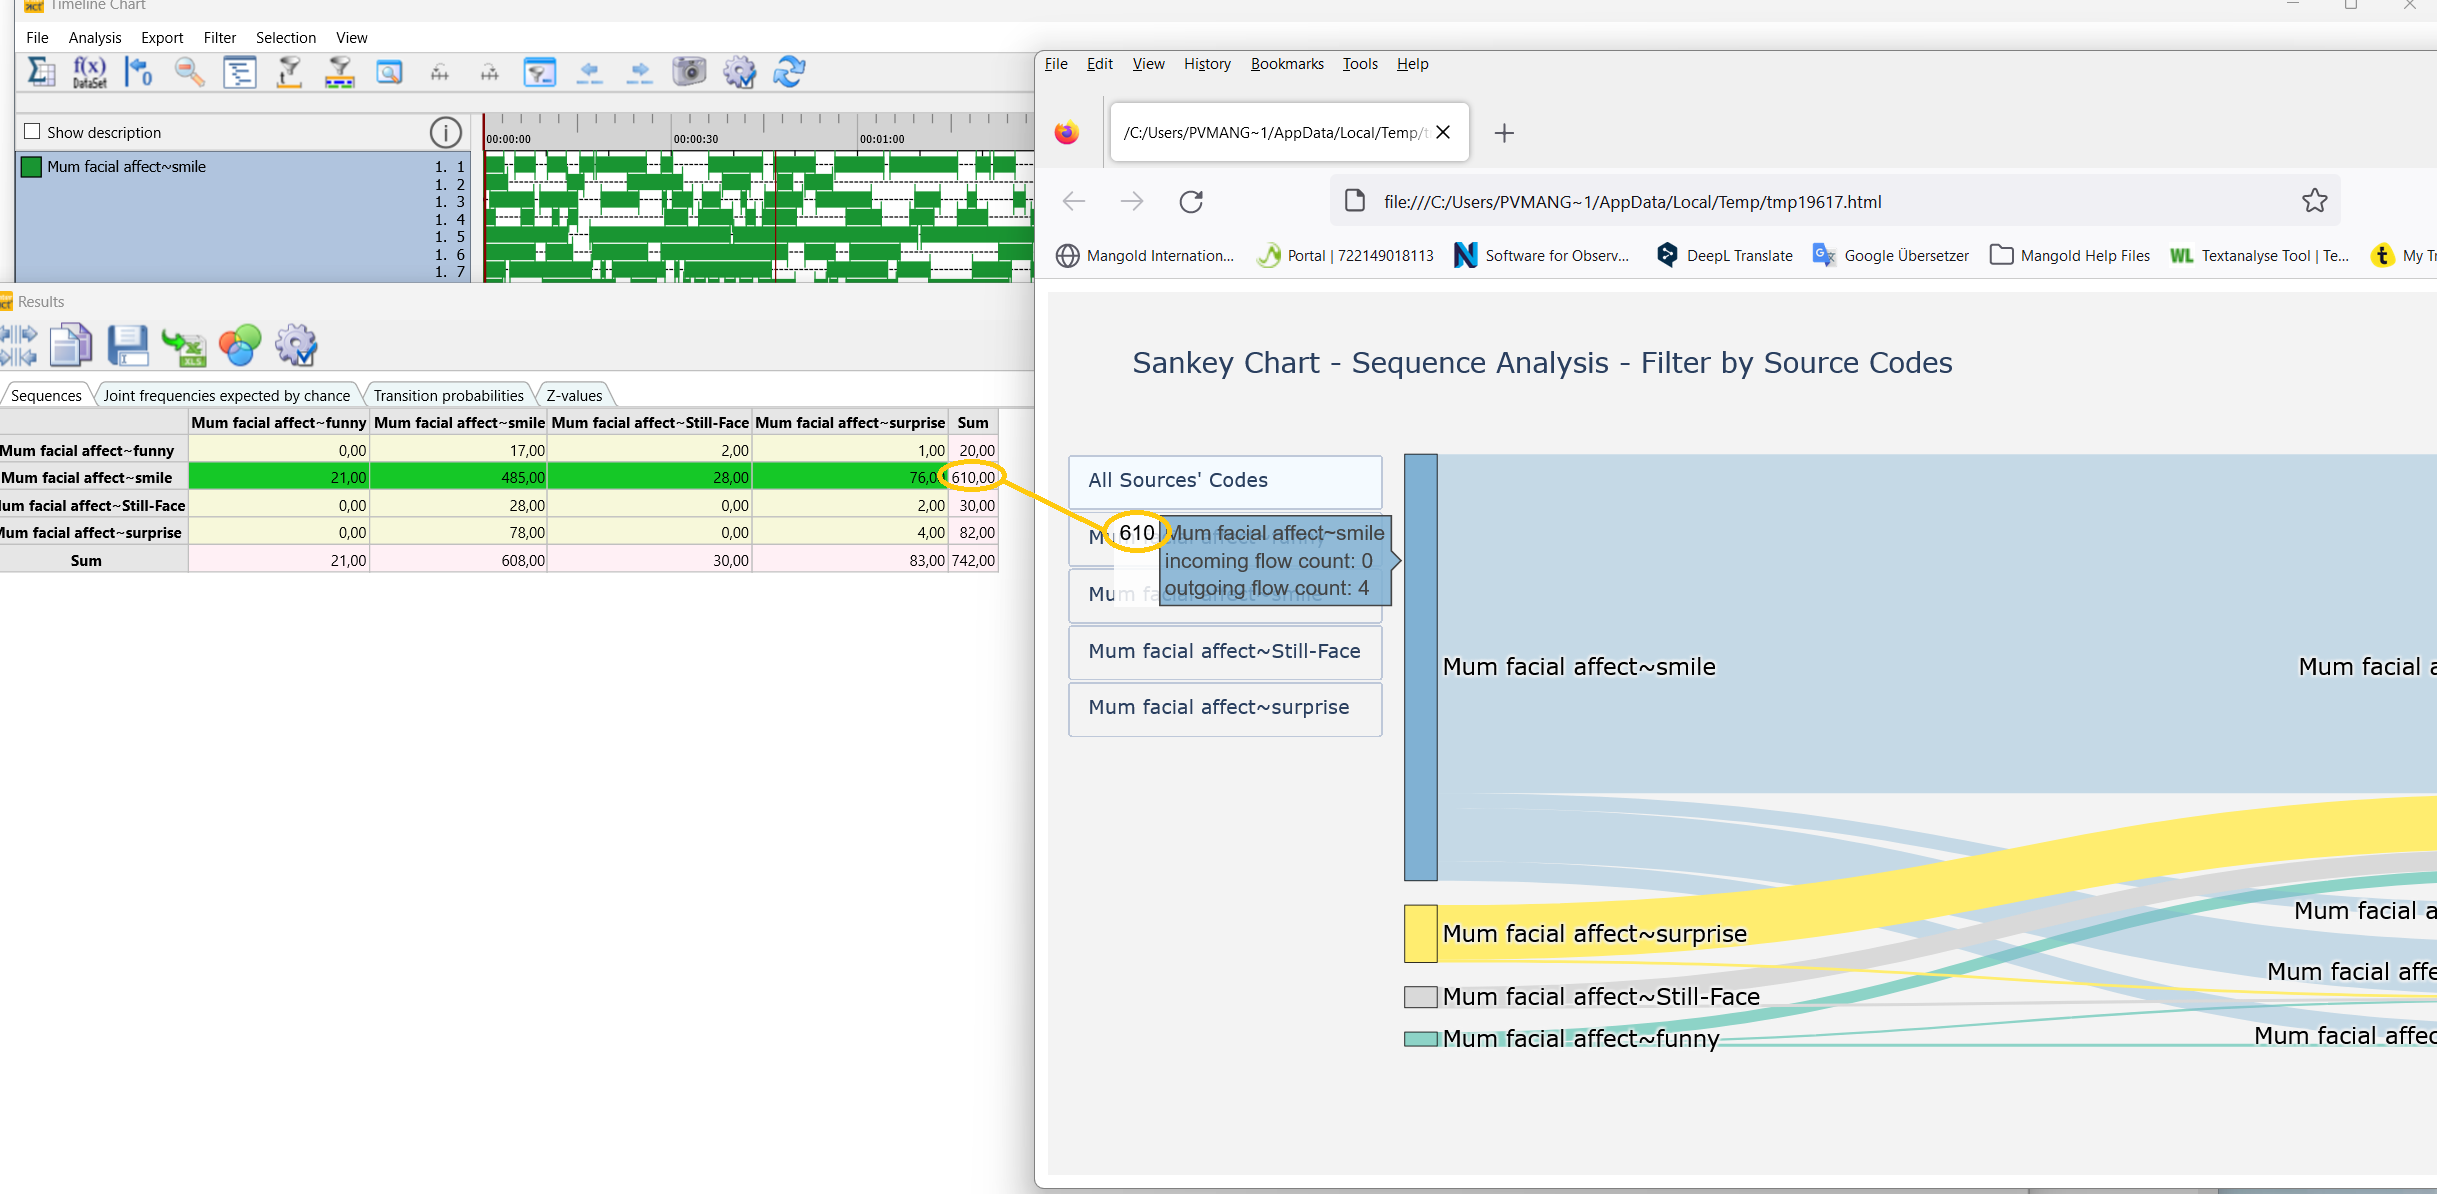
The values on which this diagram is based, match those of the result table from the Lag Sequential Analysis:
▪Hover your mouse above a connection to see the number of sequences that were found for that sequence type.
▪Hover you mouse over the head of each line to see the total number of occurrences from left to right - matching the totals of the lines within the Lag Sequential Analysis frequencies results table.
▪Hover you mouse over the tail of each line to see the total number of occurrences from top to bottom - matching the totals of the columns within the Lag Sequential Analysis frequencies results table.
Sankey Diagram Tools
Wihtin the browser window, the Sankey diagram offers a few tool to capture the diagram or part of it. You can find the available tools in the upper right corner of the diagram, if you move your mouse about:

Camera symbol: Downloads the visible plot as a png file.
Home icon: To redraw the diagram as a whole.