The Time Line Chart, discussed in DataSet based statistics, offers many 'secret' routines that you do not expect at first sight.
This section describes how you can transform Event based data into interval based data!
This is especially useful for further data processing that requires interval based data.
IMPORTANT:Make sure the selected DataSets do NOT overlap in time!
All data is accumulated, and only the first occurrence of a Code in an interval is counted.
To export all data at once, use the command Concatenate DataSets, to remove all gaps and overlaps between DataSets.
The Principle of Interval based Export Routines
In all cases, it works like slicing up a loaf of bread.
Presume that the current content (all visible codes) of the Time Line Chart is your bread. The length of you bread is determined by the total length covered by the time borders of the selected DataSets. The thickness of your slices is set by the interval width on the Grid tab of the TLC options. In this sample, the grid is set to 1 second, the most accurate results are achieved if you use slices of just 1 frame.
During the export, you start cutting of slices from the very start of the Time Line Chart. Each slice is represented by a single line in the export file. In the Time Line Chart, the slices look like this:
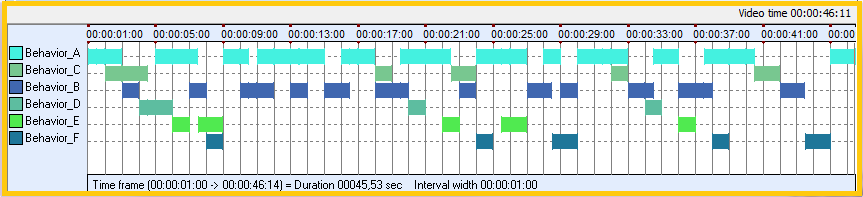
Content per Slice
Per default, a Code is exported whenever it covers at least 50% of the duration of the interval length (= one slice).
If you want to export every occurrence of a Code the moment it is detected within a 'slice', you need to adjust this percentage. Same thing, if you only want to count Codes that cover an interval completely.
▪Click the Settings ![]() icon, within the Time Line Chart window.
icon, within the Time Line Chart window.
▪Switch to the Export tab.
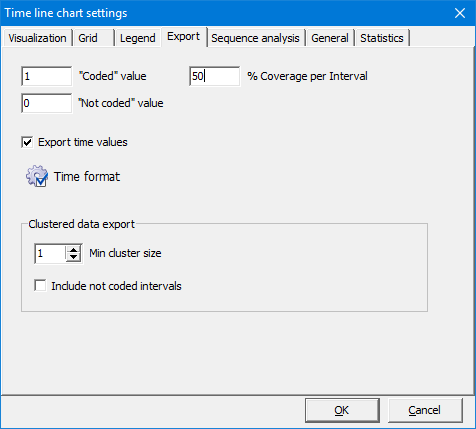
▪Change the percentage within the % Coverage per Interval field, to adjust the outcome of the export routine.
Obvious Issues
•If no Codes are available in the first slices, because e.g. the start time of the DataSet is set to 00:00:00:00 but your first event is only logged after 10 seconds or so, you get many lines showing just 0 for all columns.
•If there are gaps between Events or between DataSets, you get lines showing only 0.
•If the time information of different DataSets overlap in time, maybe because they are based on different video files, multiple codes are counted as one! This is because they fit inside the same 'slice'.
INTERACT does have of course solutions for all issues:
Remove 'Empty' Lines
To get rid of the unneeded 'empty' lines at the start and/or the end of your DataSets:
▪Click Transform - Time Values - Set Borders ![]() .
.
This command adjusts the start and end time for all DataSets, to exactly include all Events. For further details read Using DataSet Time Borders.
Remove Gaps and overlaps between DataSets
To ensure that none of the DataSets overlap in time and to remove all gaps between DataSets:
▪Select Transform - DataSets - Time Shifts > ![]() Concatenate .
Concatenate .
This command virtually queues all DataSets in the order of appearance. For further details read Move DataSets Virtually in Time.
Available Interval based Export Routines
The Time Line Chart offers the following interval based export routines: