SSG Toolbar 'General'
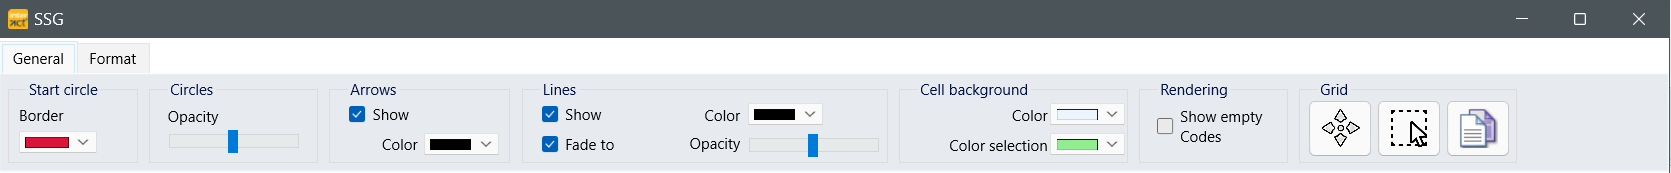
This toolbar holds various options to change the appearance of your data within your State-Space-Grid graph:
oStart Circle- The first Event of the currently displayed data. You can change the appearance of this first Event by changing the color of its border.
oCircles - All Events are represented by Circles. You can alter the transparency with the slider.
oArrows - To indicate the order of your Events, arrows can be displayed. You can specify the color of those arrows.
oLines - The lines, connecting the circles, represent the order of the Events and can be turned off and on to your liking. The Fading to option makes them grow over time. The color and the opacity of those lines can also be changed.
oCell Background - Specifies the general background color as well as the color of selected cells.
oRendering - Allows you to hide all events that contain no Codes or just one Code.
oSelection tool - Allows you to highlight specific cells. For details read SSG Statistics.
oShifter tool - Enables you to move circles within a cell, to improve readability.
oCopy icon - Copies the content of the grid in the Windows clipboard, so it can be transferred to another program.
Data selection: Filters
In case you selected multiple DataSets while opening the State-Space-Grid, you can show and hide any of those DataSets to your liking, on the Filters tab at the far left:
▪Select the DataSets to be displayed within the Sets area.
▪Within the Classes area, select the Classes you want to display on the X- and Y-axis.
Note: To limit the number of Events, use the sliders at the bottom of the SSG window to adjust the visible time frame, as explained in SSG Time Line.
Circles colors
A set of random colors is predefined in a separate color list.
•Each DataSet receives a color from this pool of colors.
•The current color is displayed behind each Set.
•Changing the Set color, does not influence the default color of that Set.
To permanently change the colors for you Sets, you need to adapt the default colors list:
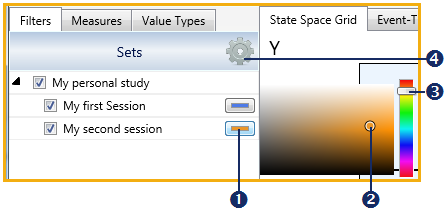
|
Color picker - Shows the currently selected color per DataSet. |
|
Current colorindicator - The position of this little circle sets the current DataSet color |
|
Color range indicator - The available color ranges can be selected by dragging the slider. |
|
Default colors - The Set of predefined colors can be edited through this gear. |
Change Session Color
If you only want to change one or more colors for your current chart:
▪Click the Color picker![]() behind the Set of which you want to change the color.
behind the Set of which you want to change the color.
▪Select a color range with help of the Color range slider![]() .
.
▪Drag the Current color indicator ![]() to the color intensity you prefer.
to the color intensity you prefer.
▪Click into an empty area to make the color range selector disappear.
Change Default Colors
If you want to predefine your favorite default colors, which are applied automatically to the Sets by order:
▪Click the Default Colors icon ![]() to open the default color list.
to open the default color list.
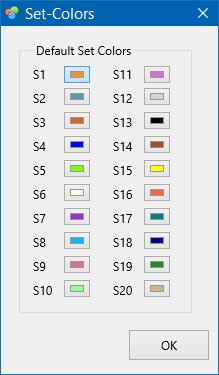
▪Click the color you want to change.
▪Change the color range and pick the color you want like described before.
▪Close the dialog if you are node.
All changes are applied instantly to you current graph!