If your data contains time gaps, there will be situations in which only for one of the selected Classes a Code was given (or no Code at all).
In those cases, the SSG Graph shows circles for Codes of only one Class in either the first column or the bottom row, instead of in a cell that represents a Code in both Classes. We call those gap-related occurrences Empty Codes:
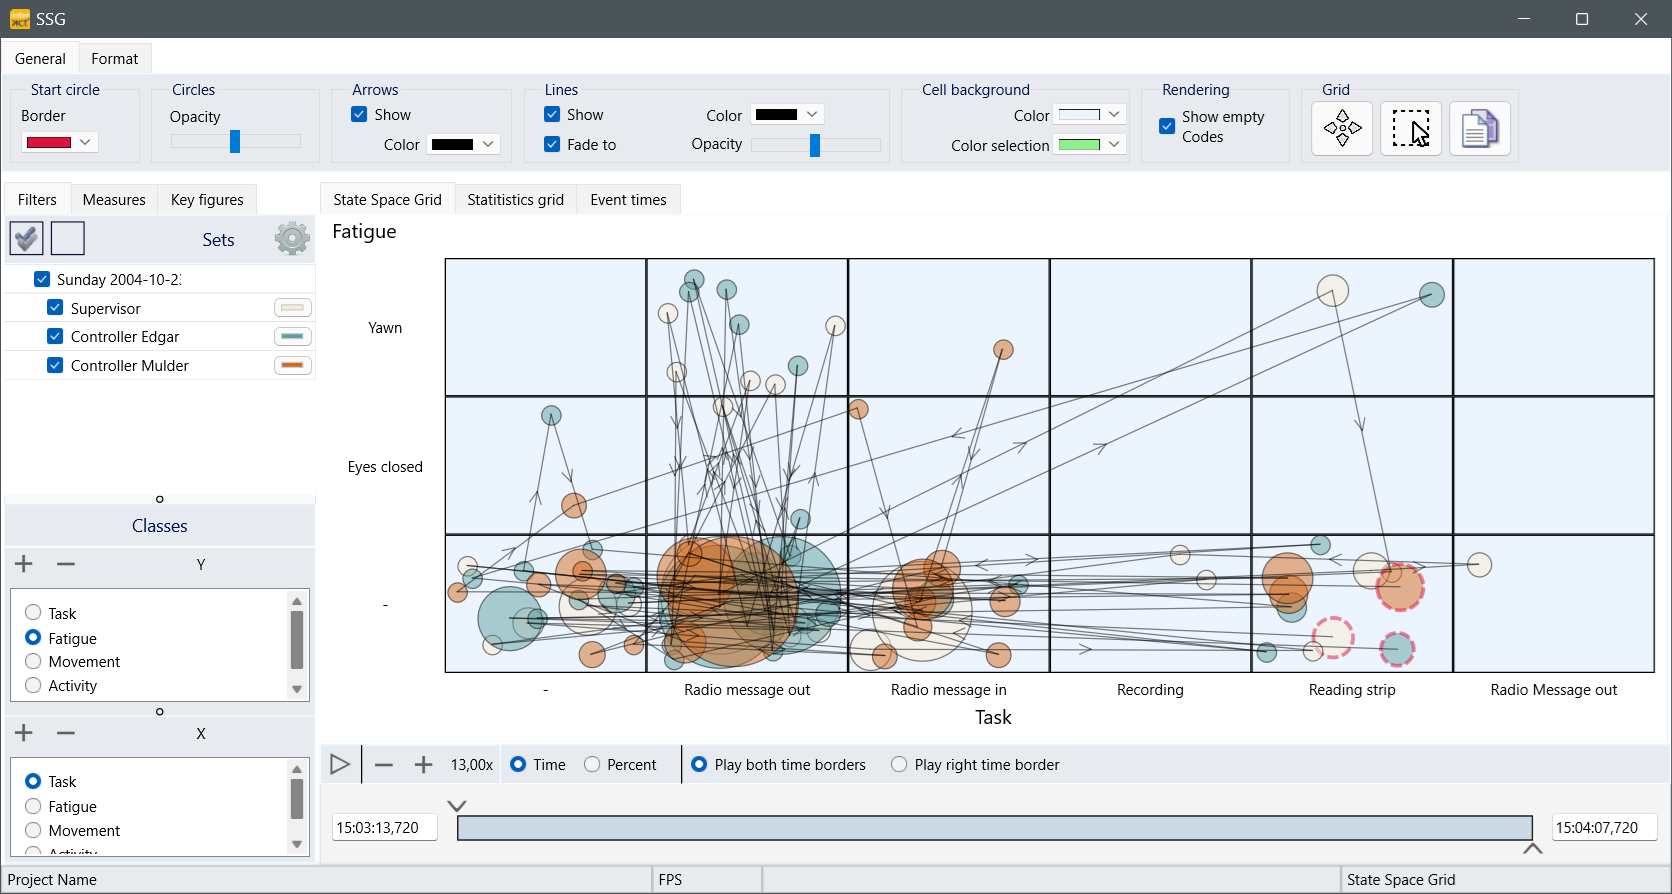
These circles occur when your data contains gaps. Either for both Classes (nothing is coded for that time sequence, at least not for the two selected Classes) or for just one of the Classes (No Code logged for the other Class during that period).
In this example picture, the gaps are obvious, because there is a lot of not coded time inside this Air_Traffic_Controller.xiact sample file.
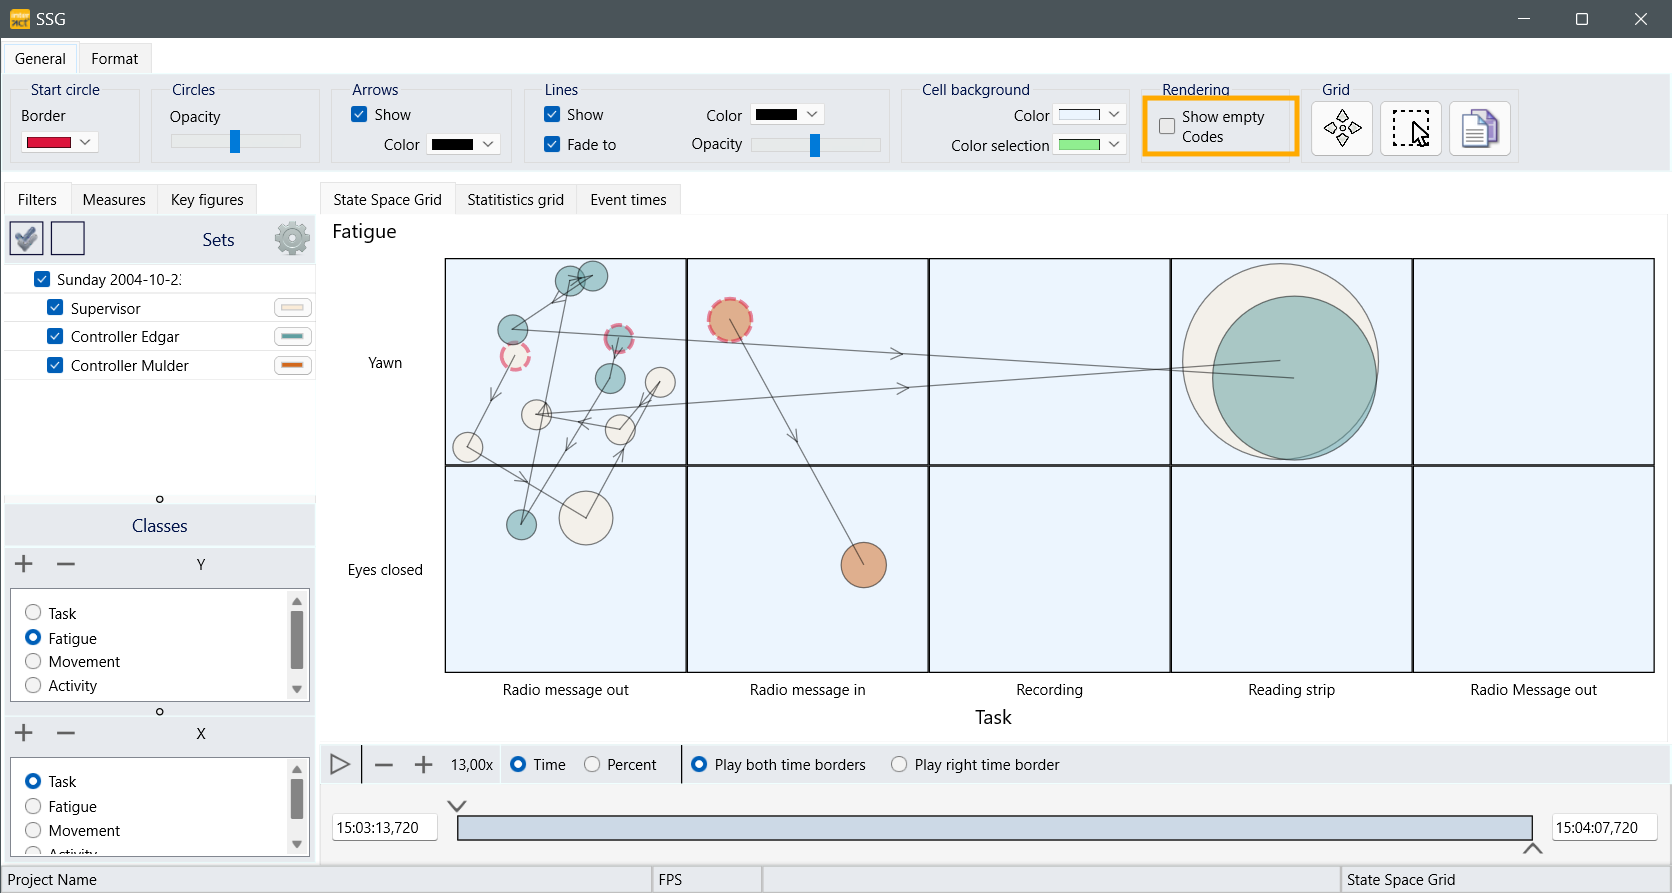
If I am only interested in the situations for which a Code was Coded in both Classes, the solution is easy:
▪Clear the option Show empty Codes to get rid of them all.
The same two Classes now look like this, with only overlapping sequences remaining:
Exhaustive Data
If your data should be exhaustive, but still shows (many) tiny dots in the an 'empty' row or column, you might be suffering from the fact that the State-Space-Grid module is calculating in milliseconds instead of whole frames.
Even if your Events look truly sequential on frame level inside your INTERACT document, these gaps might still occur.
When logging Events, we always try to round the stored value to a multiplied value that fits the fps value, but this sometimes does not work 100% correct, due to internal latencies, or the FPS value for a file has been changed, or plain math.
Especially at 30 or 29,97 fps things become really tricky… (at 25 fps we usually do not have these issues because than 1 frame = 40 ms.)
If you take a look at these 'Empty codes' sequences on the Event Times tab in the SSG you'll notice that those sequences are usually only a few milliseconds, which is a duration that is not even codable, because at 25 fps a single frame lasts for 40 milliseconds (at 30 fps for 33,33333 milliseconds which inevitably leads to rounding issues).
Adjust millisecond values
To smoothen things in the background, you can use the Transform - Time Values - Align ![]() command, which adjusts all millisecond values to match a rounded version of your current frames per second value of your document, based on the current fps for your data file.
command, which adjusts all millisecond values to match a rounded version of your current frames per second value of your document, based on the current fps for your data file.
That often resolves most of the gaps, especially if you merged files that were logged with different FPS values.
At 30 or 29.97 fps there will still be an occasional slip, simply because of plain maths but at 25 or 50 fps all discrepancies are usually solved.
(If you switch your time display to hh:mm:ss.ms instead of …:frames (you can do that in the Program settings) you can see if something changes while running the Align command)
Statistics
Showing those Empty Codes or not does NOT influence the total duration or the frequency for a specific combination.
Showing the Empty Codes or not DOES influence most of the other measures:
obecause the overall number of Events is much higher, averages drop tremendously.
oreturn times are influenced because there might be a return from something that does not exist.
Display empty Columns
If your Coding system contains Codes that were not coded in every file, you will notice a difference in the number of rows and columns between files.
To create identical charts for all sessions, you have the following options:
Merge all Files
The easiest fix for this is to merge all data files before analysis, because than your data file does contain all Codes ever coded.
To create a chart for specific session only:
▪Select all Sets at once when calling the SSG.
▪Clear the selection for all sessions that should not be displayed simultanously wihtin the SSG.
Create a Dummy DataSet with all Codes
If you do not want to merge all your files and still want to display Codes that are not really coded, you need to create a dummy DataSet in which you enter all Codes required:
▪Create a Dummy Set using the ![]() icon and enter a proper description like 'SGG Content' or similar.
icon and enter a proper description like 'SGG Content' or similar.
▪Within this new empty Set, use the ![]() icon to create empty Events for required Codes.
icon to create empty Events for required Codes.
▪Enter every required Code for each Class into those dummy Events..
Something like this:
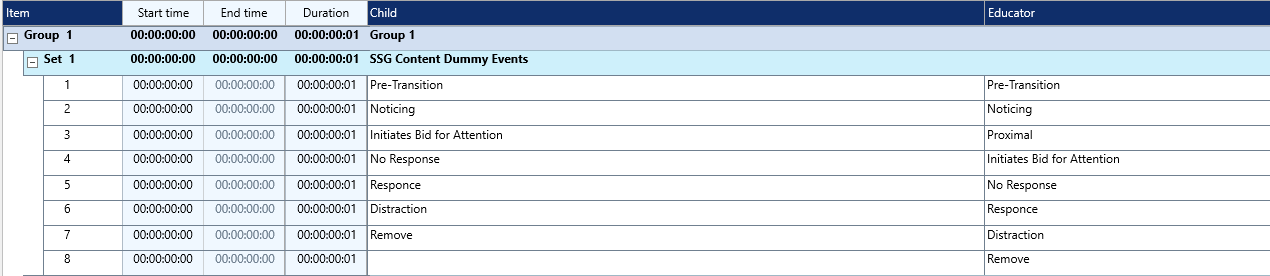
Note: The time information is irrelevant, so you do not need to run the video and all Time information can be 00:00:00:00.
If you select this Dummy Set while calling the State-Space-Grid, all Codes for all Classes are shown in the SSG matrix.
▪Clear the selection for this Set within the State-Space-Grid window, to hide its circles from the chart.
| TIP: | You can easily transfer an already created dummy DataSet to another file by means of copy and paste. |