To export your Codes over time, split by Codes, the required functionality can be found in the Timeline Chart.
This analysis is a 100% frame accurate presentation of all your data logged.
Per time interval (free definable on a single frame base), you get a numerical matrix with values for "coded/not coded" for all Codes. The so exported data can be analyzed with other applications e.g. patterns of simultaneously occurring behavior (values in one line) or successive behavior (values across multiple lines). Also read Cluster data Export and Lag sequential analysis.
Note: This export routine can be used for all data, because each Class/Code combination results in a separate column.
Export data
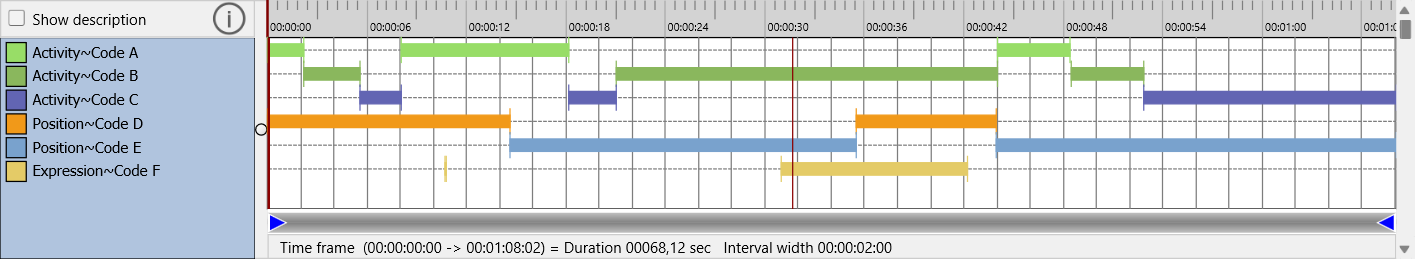
▪Visualize the data to be exported in the Timeline Chart
Warning: If the data file contains multiple DataSets that overlap in time, make sure you select only 1 DataSet when opening the Timeline Chart!
For this routine, all data is analyzed per time slice meaning that all overlapping Sets are looked at as if they where one.
▪Open the TLC settings ![]() dialog.
dialog.
▪Switch to the Grid tab.
▪Set the preferred Time interval
▪Confirm those settings with OK.
▪Choose Analysis - Export data per codes from within the Timeline Chart window.
▪Verify the settings in the upcoming dialog:
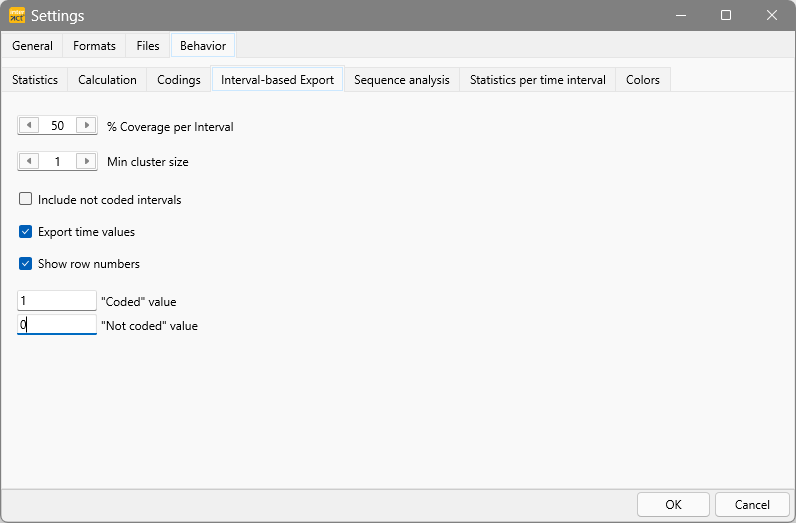
o% Coverage per interval - Specify how much of the interval you defined must be covered by a Code in order to be counted.
oMin. cluster size - ONLY relevant for Cluster data Export.
oInclude not coded intervals - If you want to add lines for periods were no Events were logged.
oExport time values - Inserts the start time and offset time for each interval in front of each line.
oShow row numbers - Inserts a row number in front of each interval line.
o"Coded" value - Only relevant for Export per Code! Enables you to specify what should be entered if a Code was logged in an interval. Enter 1 if you want to receive a 0/1 Matrix.
o"Not Coded" value - Only relevant for Export per Code! Enables you to specify what should be entered if a Code was NOT logged in an interval. Enter 0 if you want to receive a 0/1 Matrix.
▪Confirm your settings by clicking OK.
INTERACT now generates a MATRIX of your data:
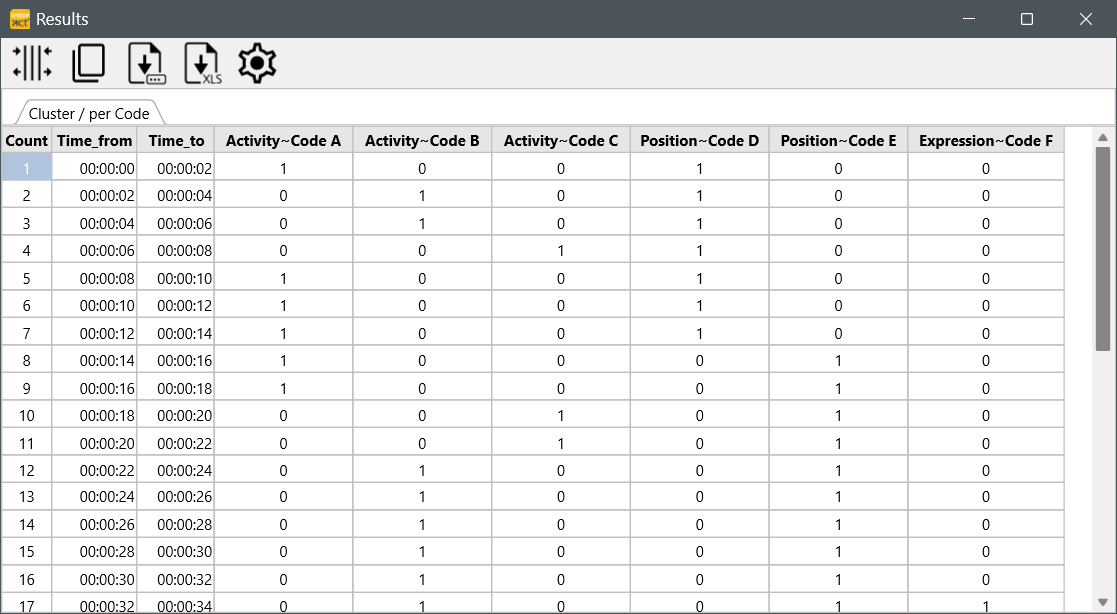
Note: This routine does NOT count multiple occurrences of a Code per interval. It just shows if a Code was present yes or no.
Every line (except the header) represents a time interval. How to adjust the interval width is explained in Interval granularity.
NOTE: In exports with grids > 1 frame, Numerical values (from !Classes) are summarized per interval (e.g. number of eye-blinks per second within 10 second time intervals)
What happens?
Whenever a behavior covers more than the specified percentage of the interval, as set for the current Timeline Chart, INTERACT regards it as a 'coded value' (1) for that interval. Otherwise INTERACT interprets it as a 'missing value' (0) for that interval.
| TIP: | What value is used for "coded" and "not coded" intervals, can be defined individually, as described in the Export values and settings. Here you can also define to include time values or not and in what format. |
The resulting export file contains as many columns, as different Class/Code combinations are found in the current Timeline Chart window. For every visible interval you receive a data line. You can look at it, as the Timeline Chart with interval grid lines shown (options - grid - 'full lines'), turned 90 degrees clockwise.
Transfer Results
To transfer or export your results to another application, you can:
oCopy ![]() the data and paste it into your target application.
the data and paste it into your target application.
oSave as.. ![]() a csv or text file
a csv or text file
oExport to Excel ![]()
A more detailed explanation can be found in Export Results.