This function offers versatile possibilities for data filtering and aggregation during export. The further processing of the adjusted data will be a lot easier.
The Idea: For Data export per Code, all Class/Code combinations and defined time intervals are examined, to see if a Code occurs or not. If the interval width (Grid) has been set to a very small value (e.g. one frame), you receive a huge file, holding a lot of lines with exactly the same data.
Even a behavior of just 1 second, is listed 25 or 30 times in a row, depending on the fps rate of your video. E.g:
101001001
101001001
101001001
101001001
101001001
101001001
The Cluster Data Export, aggregates this data by not extracting identical information multiple times. Instead, the behavior is extracted once and additionally, the number of intervals this data repeats itself is summarized. This sum is entered in an extra column called Count. E.g.:
6: 101001001
The behavior detected within an interval, is referred to as a "Cluster". By defining a minimal cluster size, you can additionally sort out coding errors or uninteresting behavior. Take a look at the following examples.
Course of action
The following options both influence the results of this routine:
a) Analysis - Evaluation - Timeline Chart ![]() / Settings
/ Settings ![]() / Grid tab / interval
/ Grid tab / interval
b) Analysis - Evaluation - Timeline Chart ![]() / Settings
/ Settings ![]() / Export tab / min cluster size
/ Export tab / min cluster size
Coding example
Every field in the table below represents one single video picture (= 1 frame). „1“ entered into a field, means that the behavior was coded in this specific time interval.
Code |
Interval -> |
||||||||||
A |
|
1 |
1 |
1 |
1 |
|
|
|
|
|
|
B |
|
|
|
1 |
1 |
1 |
1 |
1 |
1 |
1 |
|
C |
|
|
|
|
|
|
|
|
1 |
1 |
1 |
▪Click Analysis - Evaluation - Timeline Chart ![]() and select the relevant Codes, to create the Timeline Chart displaying only the data that is of interest to you for this analysis.
and select the relevant Codes, to create the Timeline Chart displaying only the data that is of interest to you for this analysis.
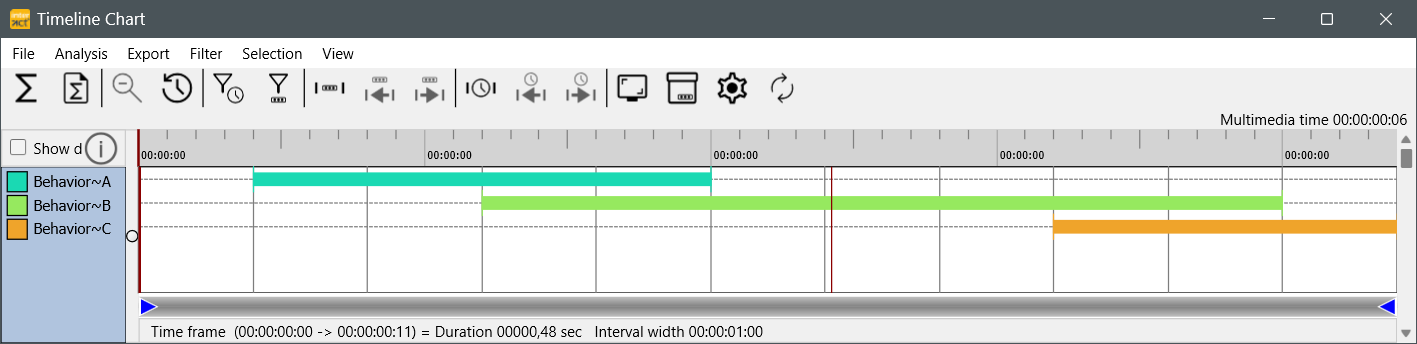
The very same data looks like this in the Timeline Chart:
▪Click Settings ![]() , to open the Timeline Chart setting dialog.
, to open the Timeline Chart setting dialog.
▪Adjust the Interval size, on the Grid tab (See Define the minimal duration of behavior).
▪Set the Minimal cluster size, on the Export tab (See Suppress wrongly given Codes).
▪Confirm your settings with OK.
▪Select Analysis – Cluster data export... from the menu within the Timeline Chart window.
INTERACT present its results like this:
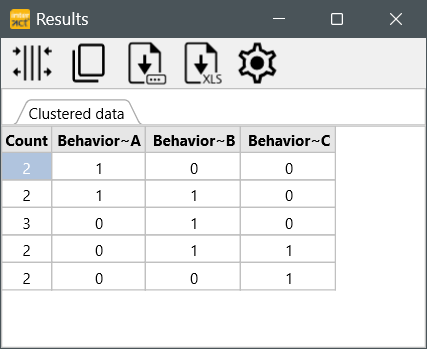
This is the result of applying the following rules:
oIf the interval width (the Grid option mentioned above) is set to 1 (=1 frame)
AND
othe cluster size is set to 1 (i.e. the coded behavior has to last for at least one frame and has to occur at least once - applicable to every code logged).
The result, of the coding example above, looks like shown in the table below (the horizontal reading direction of the table above - analog to the Timeline Chart - equals the vertical reading direction of the table below - analog the export file):
Count |
A |
B |
C |
|
Remark |
3 |
1 |
0 |
0 |
|
„A“ was coded 3 times in succession. |
2 |
1 |
1 |
0 |
|
The pattern „AB“ was coded twice succession. |
3 |
0 |
1 |
0 |
|
„B“ was coded 3 times in succession. |
2 |
0 |
1 |
1 |
|
The pattern „BC“ was coded two times in succession. |
1 |
0 |
0 |
1 |
|
„C“ was coded twice in succession. |
11 |
|
|
|
|
|
Because the interval was set to 1, and therefore every single frame was taken into account, the summary of the new column ‚Count’ (=11) equals the number of frames used in the coding example above.
Transfer Results
To transfer or export your results to another application, you can:
oCopy ![]() the data and paste it into your target application.
the data and paste it into your target application.
oSave as.. ![]() a csv or text file
a csv or text file
oExport to Excel ![]()
A more detailed explanation can be found in Export Results.
Other possibilities
By changing the Interval and Minimal Cluster size, you can influence the results to match your requirements. Those settings allow you to:
•Suppress very short/insignificant behavior by defining the minimal duration of behavior
•Reduce data noise using the Interval width Influences