IMPORTANT: This function requires a working Python installation. All required modules come with the installation of INTERACT per default.
In case of an error message, read the topic Python integration to learn how to fix this.
A box plot or boxplot chart graphically represents the location and dispersion of numerical data by their quartiles. In addition to the box in a boxplot, lines (called whiskers) extend from the box, indicating variability outside the upper and lower quartiles.
This is how you create a Boxplot directly from within INTERACT:
▪Select Analysis - Advanced - Visualization ![]() > Box Plot Diagram from the menu.
> Box Plot Diagram from the menu.
▪Select the Codes and Classes you want to analyze.
•If your data file contains more than one DataSet, select the required DataSet(s) from the Select DataSet dialog.
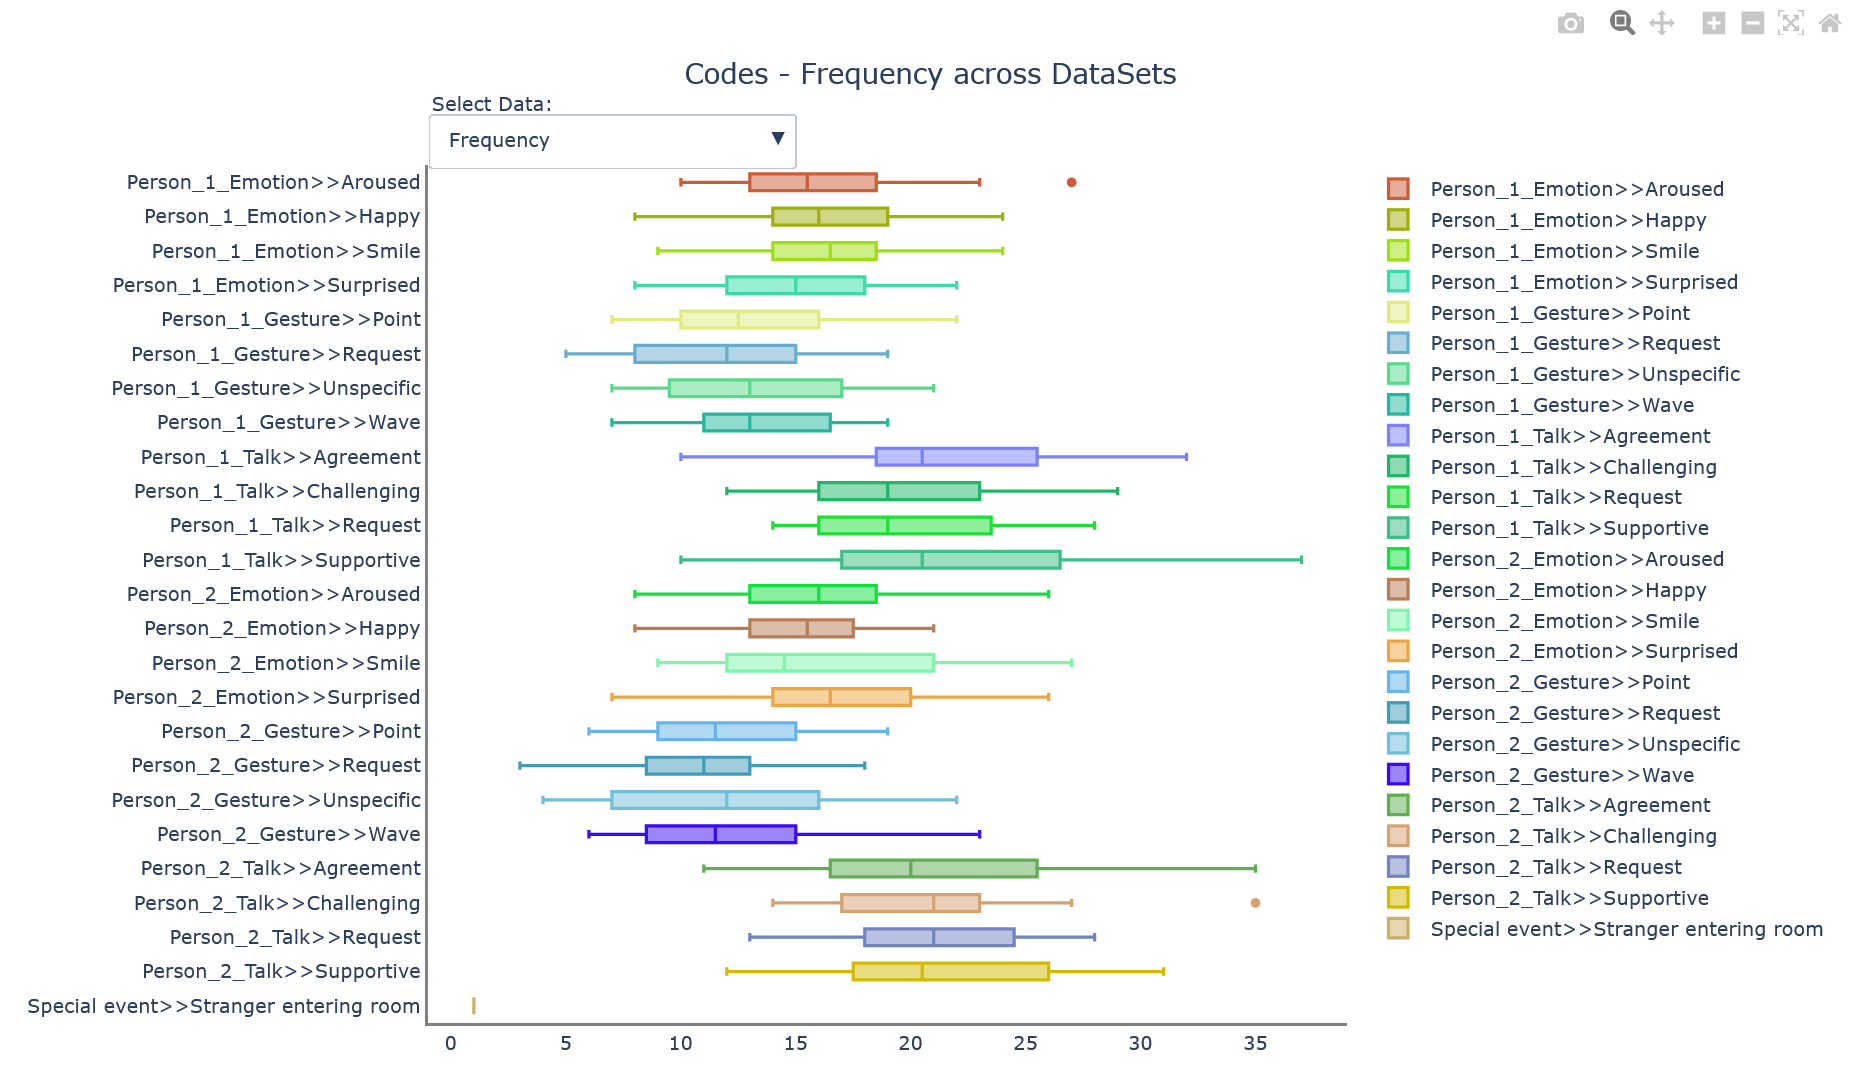
After confirming the last dialog with OK, the new Boxplot is displayed in a new tab of your default internet browser:
The size of the diagram depends on the size of your browser window.
Resizing the browser window automatically redraws the diagram for a perfect fit.
Diagramm Options
oSelect the value type from the Select Data drop-down list. The first values displayed are Frequencies.
oYou can remove Codes from the chart by clicking on a Code in the legend.
That Code becomes inactive for this chart. Click again to reactivate that Code.
In the top right corner of the diagram there are some icons to adjust the view of your diagram:
oExport screen shot - To export the current graph, click the little Camera icon in the top right corner.
| TIP: | The resulting png file is stored in the default downloads folder, as specified in the storage settings of your browser. If your browser is set to 'automatic save all downloads', each downloaded chart png is automatically stored in this default download folder as a 'NewPlot' file. A sequence number is automatically added to each file name, to prevent overwriting previously saved files. To change this behavior, alter the download settings of your browser. BEWARE: This setting affects ALL downloads! |
oZoom selection - Select the magnifying glass icon and drag across the diagram with your mouse to zoom into that selection
oPAN Box position - Click the cross-like icon to move the boxes inside the diagram
oZoom in - Click the + to enlarge the whole chart
oZoom out - click the - icon to shrink the whole chart
oAuto scale - To return to the original view, click the auto scale icon.
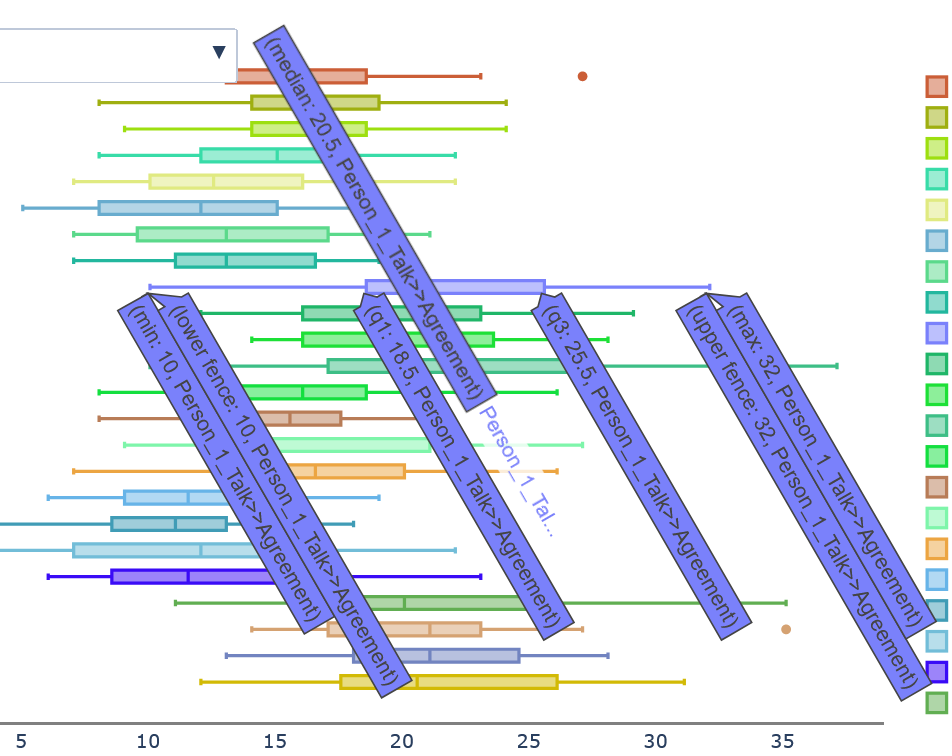
Code Details
Move your mouse across a box to see the details for that Code: