The Full Statistics result table lists all Metadata-Values per DataSet, at the far right of the table.
This is helpful to identify what set is about what kind of data, but it does NOT provide you with the number of occurrences per metadata-value.
It is now possible to get summaries of all descriptive value types for all Codes per metadata value, across DataSets:
▪Click Analysis - Evaluation - Statistics ![]() > Statistics on Metadata.
> Statistics on Metadata.
OR
▪Run Analysis - Analysis - Evaluation - Statistics ![]() from within the Timeline Chart menu.
from within the Timeline Chart menu.
▪Select the Codes you are interested in and confirm your selection with OK
▪Select the DataSets you want to analyze and confirm with Apply.
The Results dialog now lists all Code occurrences per Metadata Value instead of per DataSet:
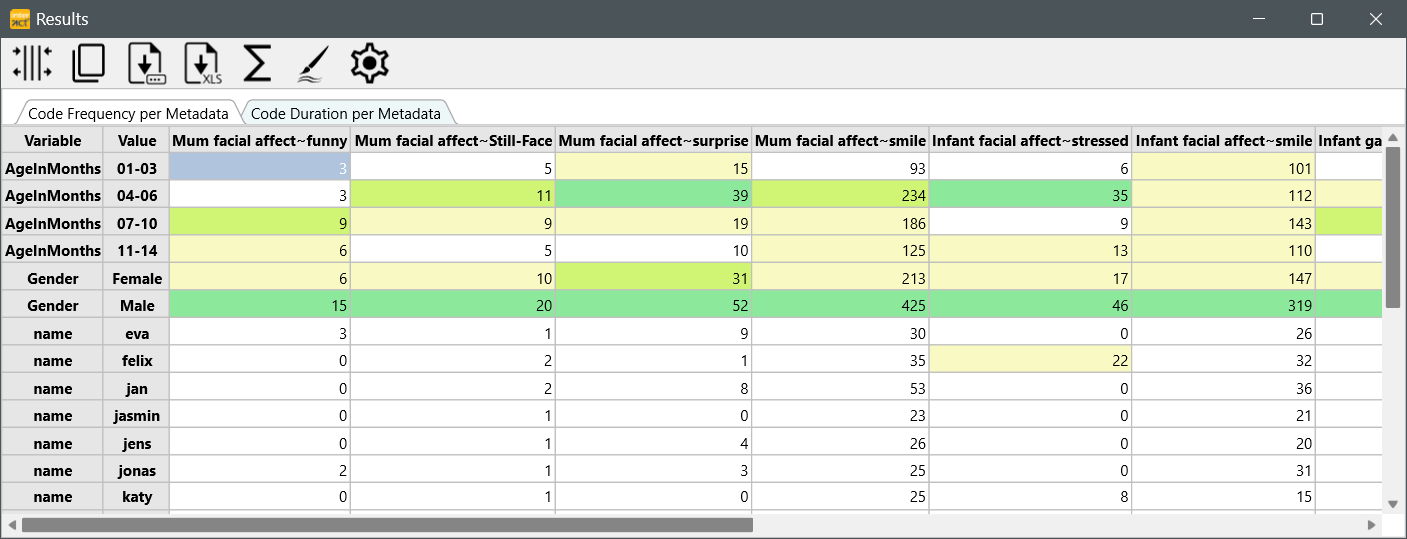
▪Switch between tabs for Frequencies and Duration values.
Futher Analysis in Excel
If you need statistics in different aggregations as available in the INTERACT Results, it is fairly easy to transfer the available results to Excel and organize your data in a Pivot-Table.
To create a pivot table in which can freely organize the level of aggregation, you need to transfer the results to Excel.
▪Click the Export to Excel button of your current Results windows
or
▪Click the Copy icon.
▪Create a new worksheet in Excel.
▪Select Home - Paste to insert the values.
Create Pivot Table
Note: This is just a very short example! Further details about creating this Excel functionality is available in the Microsoft documentation.
Once your data is available in MS Excel:
▪Make sure the selection is kept after insert.
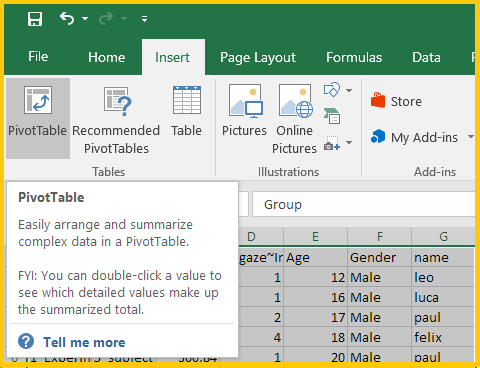
▪Select Insert - Pivot Table.
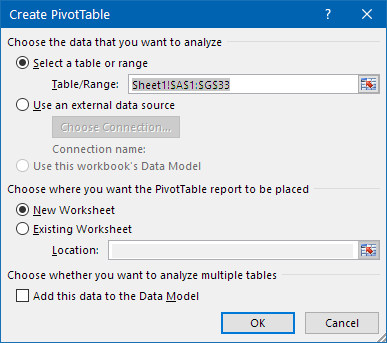
▪Confirm the dialog asking you to create the pivot table based on the selected data:
Each column from the INTERACT Full statistics results table is now listed as a Pivot Table field on the right side of your Excel Window.
Example based on Metadata
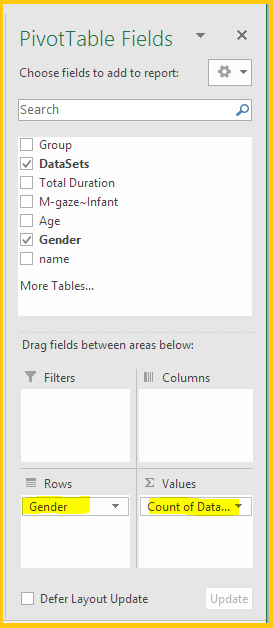
Depending on your research question, you will need to select other columns. In this example we want to know how many sessions (DataSets) were observed, split by Gender value.
▪Select one of the Meta Variables (Gender in this case)
▪Drag the DataSets field into the summary area, in order to count the occurrences per variable:
This results in a neat little Pivot Table, showing you the numbers of male and female participants:
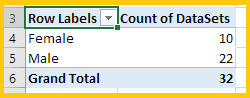
This tells you that there are 10 female participants and 22 males.
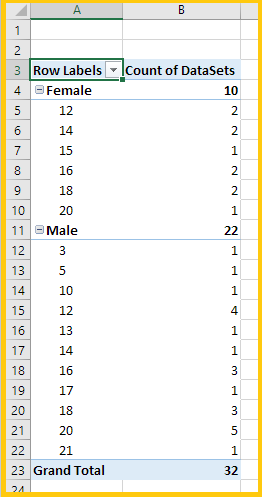
If you drag the 'Age' field into the rows area a well, the table will extend itself like this:
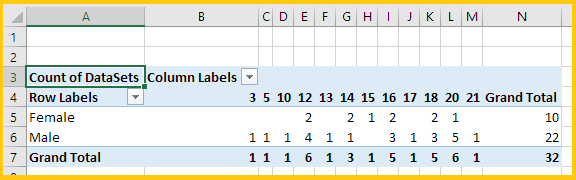
Whereas dragging the 'Age' field into the Columns area, your table will look like this:
You can create all kind of nested tables. Feel free to play around with it and take a look at one of the many Excel tutorials for this function.
Duplicate Table
To create multiple tables for separate variables:
▪Select and Copy the table just created.
▪Paste it underneath and select another Variable-Field to display.