IMPORTANT: The statistics, exports and analysis routines available within the Timeline Chart, always reflect the data currently visible in the Timeline Chart.
If e.g. you are ‘zoomed-in' on just a part of your data, only this part is taken into account in the statistics results.
This view is especially useful for compilation files, after merging multiple data files, or if you logged different test cases/situations in separate DataSets right from the start.
This way, the results can be compared very easily.
In statistical programs they speak of "cases".
▪Select Analysis - Evaluation - Statistics ![]() >Statistics per Code (tables) from the main menu
>Statistics per Code (tables) from the main menu
OR
▪Within the Timeline Chart window, click ![]() or choose Statistics per Code (tables) from the Analysis menu.
or choose Statistics per Code (tables) from the Analysis menu.
The Results window shows one statistical value per tab, with columns for each Class-Code combination and lines for each DataSet:
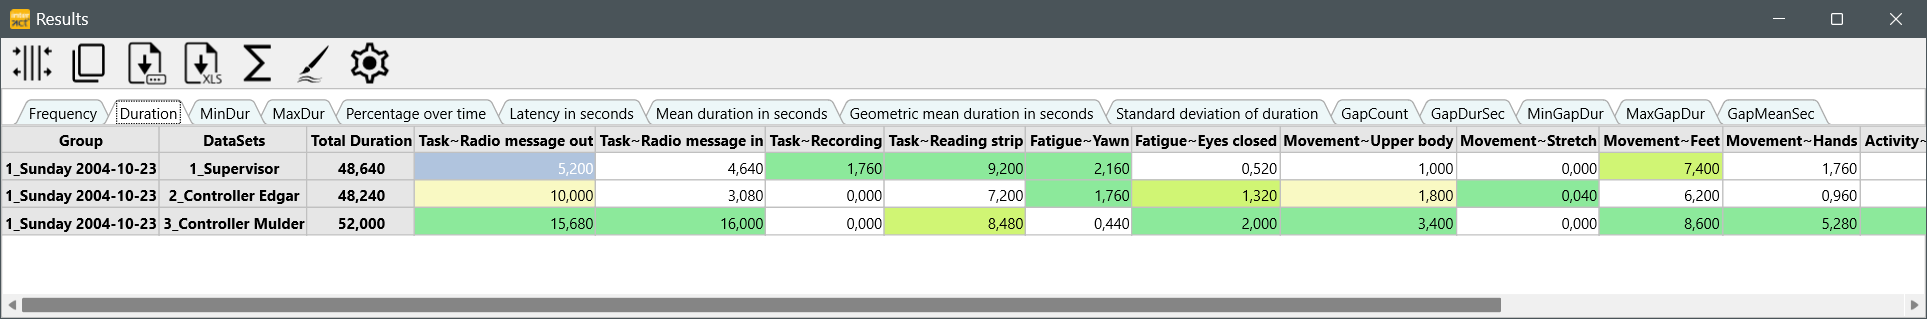
Note: This layout simplifies the processing of those results with other applications. An overview of all values per Set at once is available in Statistics on DataSets.
Per default all durations are listed in seconds.milliseconds, but you may adjust this statistics time format in the Application settings:
▪Click the Setting icon within the Timeline Chart.
▪Click Application settings at the bottom of the Timeline Chart Settings dialog.
The order of the listed Codes, is determined by their order in the assigned Code Archive.
To correctly compare multiple documents that belong to the same study, ensure that they are assigned to the same Code Archive!
Per default INTERACT displays only Codes from the current data file.
If you want to see all Codes that are available within the current Code Archive, you need to change the appropriate setting, as described in the Timeline Chart options - Statistics.
| TIP: | To influence the order of the Codes and Classes in the statistics, read the topic Sort Code Archive contents. |
Summarize the Results for all DataSets
Summarizing the sums per Code of all listed DataSets takes just a a single mouse click:
▪Click the ![]() Summary button to extend the current table like this:
Summary button to extend the current table like this:
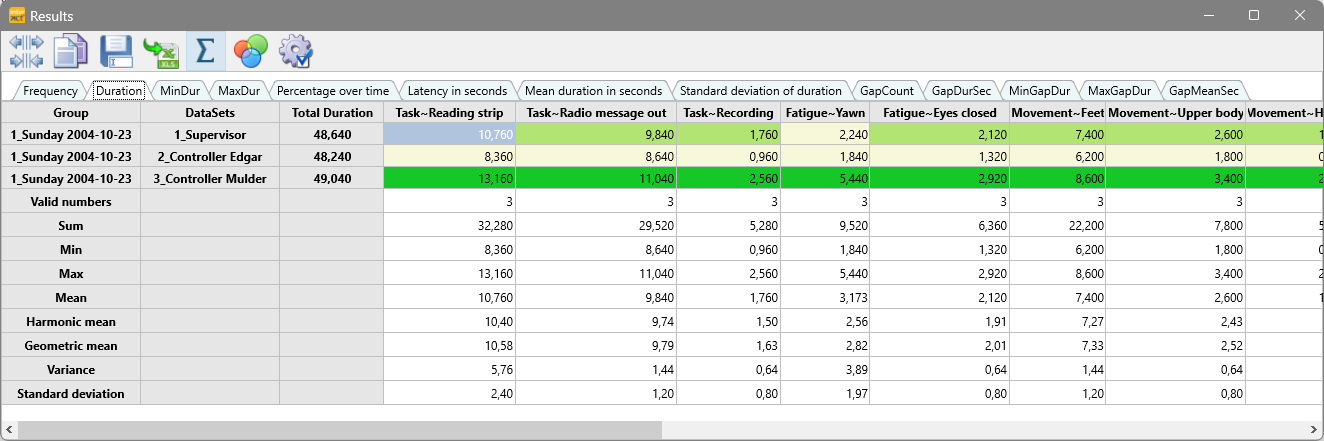
The available values tell you this:
•Valid numbers: Number of valid values found in the table for that specific column.
•Sum: Total of the listed values
•Min: Smallest value per Code
•Max: Highest value per Code
•Harmonic mean: Calculated of all listed values per Code - best applicable for rating values. Thus in this overview mainly useful for rating values within Independent variables.
•Geometric Mean: Calculation based on all listed values per Code.
There are a lot more statistical values available, but these are excluded by default. Most interesting are the Gap count values, to evaluate how long a gap was. Further details in Gap Statistics.
Navigate to Application Settings - Behavior - Statistics and select the value types you are interested in.
Visual Data Exploration
INTERACT offers a special visual data exploration routine, which is active per default:
▪The icon Visual Data Exploration ![]() in the toolbar, allows you (de)activate this functionality.
in the toolbar, allows you (de)activate this functionality.
All results are analyzed and colored in 25% bins, like this:
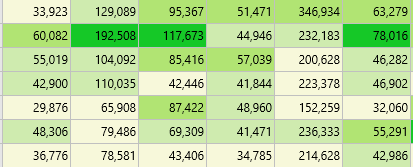
For this, all values are compared per column, and the range, between the lowest and highest value, is used to split the results into four groups:
•Color 1 is used for the values within the lowest 25%
•Color 2 is used for the values within the next 25%
•Color 3 is used for the values within the third 25%
•Color 4 is used for the values within the highest 25%
This gives you immediate visual feedback on your results.
Specify Colors
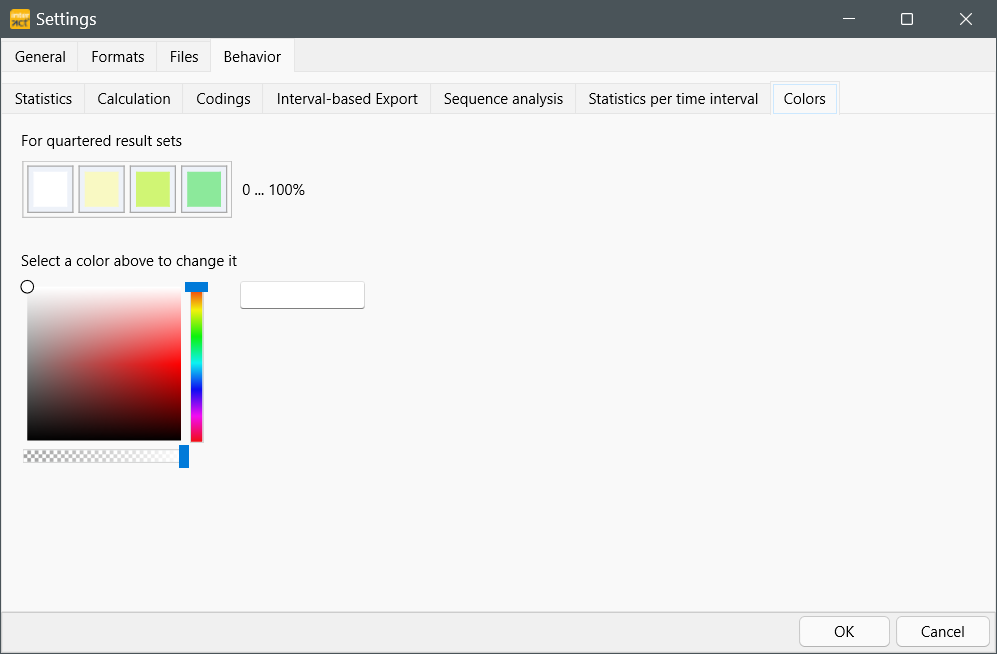
You can specify the colors for quartered result sets in the application settings:
▪Select General - Program - Settings ![]() and switch to the tab Behavior - Colors.
and switch to the tab Behavior - Colors.
▪Change the colors For quartered result sets to your liking:
Export
How to transfer this data to third party applications like MS Excel of SPSS is explained in Export Results; in most cases a simple Copy & Paste will do the trick.
| TIP: | In case the combination of the identifier for Class/Code is too long to be used in your statistical program, you can define global abbreviations for those identifier. Read more about this in the section The Code Archive, especially the topic Translate Statistical Results. |