To enable you, to play around with the most important statistic routines (even before you have collected your own data), we offer a range of example documents:
▪Select Start - File - Open ![]() >Demos from the main toolbar.
>Demos from the main toolbar.
| Beginners demo - This demo file is a little course in itself. It explains the structure of an INTERACT file and allows you to control a linked demo video. |
▪Select Start - File - Open ![]() > Demos > Beginners demo > Document: INTERACT Multimedia Demo EN to open this demo file.
> Demos > Beginners demo > Document: INTERACT Multimedia Demo EN to open this demo file.
▪Read the information and instructions within the Transcription field of each line.
▪For further details, read the topic Instruction File.
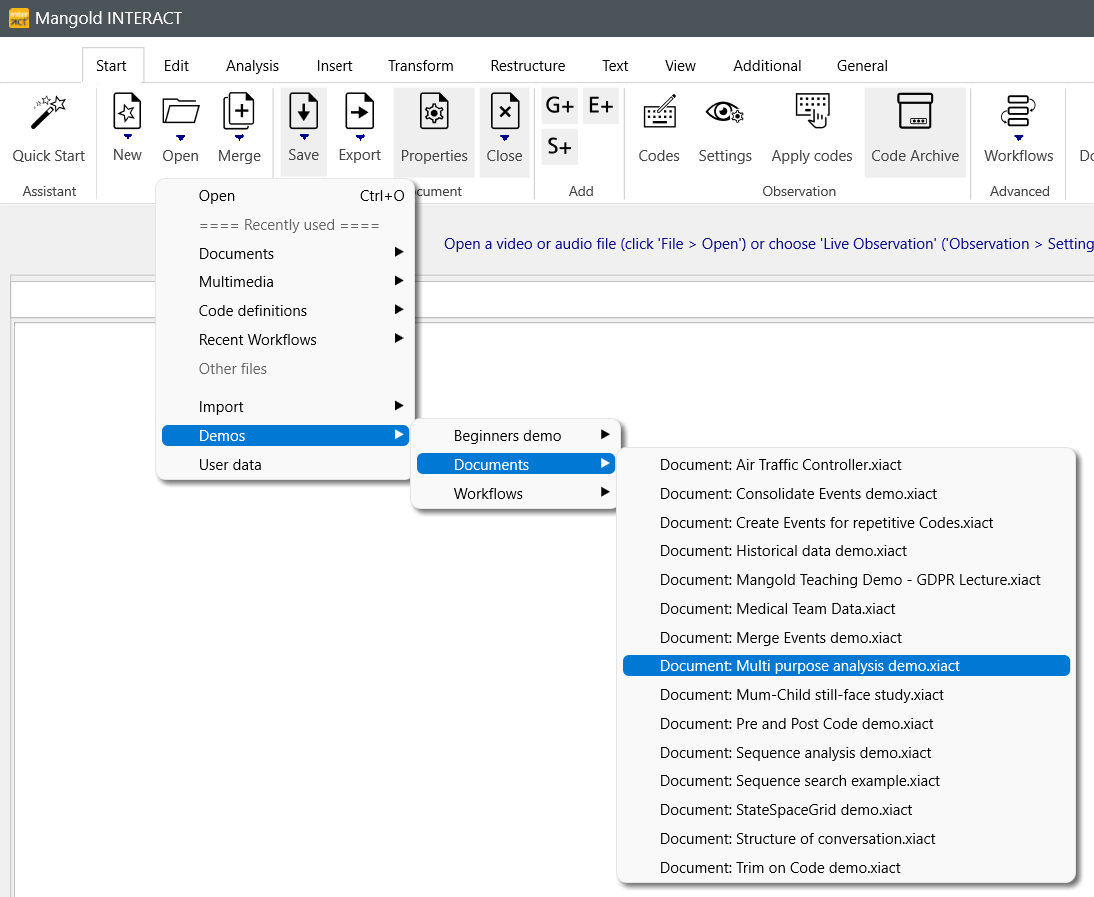
Under Start - File - Open ![]() > demos > Documents), you'll find a number of demo files with data that allow to experiment with various routines.
> demos > Documents), you'll find a number of demo files with data that allow to experiment with various routines.
▪Select an example file you are interested in:
| Multi-purpose Analysis - This data file holds two DataGroups with 10 DataSets each and a bunch of Events with Observation Codes. You can use this demo data, to explore the functionalities of the Timeline Chart and other analysis routines. |
▪Select Start - File - Open ![]() > Demos > Documents > Document: Multi-purpose analysis demo , to open this sample data file.
> Demos > Documents > Document: Multi-purpose analysis demo , to open this sample data file.
You can now carry out various evaluations:
▪Switch to the Analysis tab to gain access to the available routines.
▪For details on the available analysis routines, read ANALYSIS with INTERACT.
| Search for Co-occurring Events - This example shows the search for concurrent Codes (or behaviors). It is based on random numbers and therefore shows different values each time. |
▪Click Start - File - Open ![]() Demos > Document > Document: Mum-Child still-face study.
Demos > Document > Document: Mum-Child still-face study.
▪Select Analysis - Time Sequence - Co-occurrence ![]() to apply the co-occurrence filter to the Codes 'Mum facial affect - Smile' and 'Infant facial affect - smile' as explained in Co-occurrence filter.
to apply the co-occurrence filter to the Codes 'Mum facial affect - Smile' and 'Infant facial affect - smile' as explained in Co-occurrence filter.
| Pre- and Post-Events - If you are interested in fixed periods before and after a specific key Event, this routine saves you a lot of time. You just need to Code the key Event and INTERACT is able to automatically create preceding and subsequent Events that cover the exact time frame you want: |
▪Run Start - File - Open ![]() > Demos > Documents > Document: Pre and Post Code demo, to create a demo file.
> Demos > Documents > Document: Pre and Post Code demo, to create a demo file.
▪Select Restructure - Add - Pre and Post Events ![]() to run the demo routine and select the 'Imitative' code as you key event.
to run the demo routine and select the 'Imitative' code as you key event.
This creates a number of new Events (maximum length 30 seconds), before and after the Events with the Code 'Imitate' within the Class column 'Period'.
Note: If the Key-Events occurs within the defined interval (30 seconds in this case), the new Pre- and Post-Events are shortened accordingly.
▪Read Create Pre- and Post-Events to learn how to adapt this routine to your study
| Consolidate Events - This example shows how to summarize events with identical codes and times. |
▪To load the sample file, click Start - File - Open ![]() > Demos > Documents > Document: Consolidate Events demo.
> Demos > Documents > Document: Consolidate Events demo.
▪In the menu, choose Transform - Events - Consolidate > Merge Events with identical times and arbitrary Codes to consolidate the Events in this file.
39 Events were consolidated (Event with identical times are combined).
| Merge Events - If you want to merge separately coded Events, with the same Code, whenever they were coded successively within a specific time range (e.g. turn separate Events like 'woof' - 'woof' - 'woof' into a single Event named 'Dog is barking'), this sample is of interest to you: |
▪Run Start - File - Open ![]() > Demos > Document: Create Event for repetitive Codes, to open a demo file.
> Demos > Document: Create Event for repetitive Codes, to open a demo file.
▪Click Transform - Events - Merge ![]() to start the routine.
to start the routine.
▪User Code 'A' for the merging.
▪For further details on this routine, read Merge Successive Events.
| Space-State-Grid - Demo data for this special method (that analysis synchronized Event sequences, based on dynamic systems (DS) principles), is also available. Details about the mathematical routines of this functionality can be found in publications of Tom Hollenstein. |
▪Run Start - File - Open ![]() > Documents> Document: Space State Grid demo, to open the demo data.
> Documents> Document: Space State Grid demo, to open the demo data.
▪Click Analysis - Dyadic - State-Space-Grid ![]() in the toolbar.
in the toolbar.
▪Select the DataSets you want to include in the analysis and confirm.
▪For additional information, see Space-State-Grid.
| Trim on Code - A great routine to find all co-occurrences with a specific behavior. |
▪Open your data file or a the demo file through Start - File - Open ![]() > Demos > Example file for "Trim on Code".
> Demos > Example file for "Trim on Code".
▪Load the data into the Timeline Chart using the Analysis - Evaluation - Timeline Chart ![]() command.
command.
▪Click the Trim on code filter ![]() command inside the Timeline Chart window.
command inside the Timeline Chart window.
▪In the demo file select the Code 'Behavior - x' to see what other behaviors were coded during those periods.
▪For further details, read Trim on Code filter.
| Sequence Analysis - This add-on functionality is only available if the extra license is purchased. |
▪Open a demo file using Start - File - Open ![]() > Documents > Document: Sequence Analysis demo.
> Documents > Document: Sequence Analysis demo.
▪Select Lag Sequencial Analysis from the menu.
▪Select all Codes & Classes you want to analyze and confirm with OK.
▪For further details, read Lag Sequential Analysis.
| Inter Rater Reliability - With the Kappa routine, you can compare the content of two separate documents. |
▪Run Start - File - Open ![]() > Demos > Example files for Kappa analysis.
> Demos > Example files for Kappa analysis.
▪Click Analysis - Reliability - Kappa ![]() to start the comparison.
to start the comparison.
▪For further details, read Kappa - Inter Rater Reliability.
| | Log-term data - INTERACT can also handle data that is stretched over years! |
▪Select Start - File - Open ![]() > Demos > Documents > Document: Historical data demo to open a demo file in which the Events last for multiple days or even years, instead of just minutes and seconds
> Demos > Documents > Document: Historical data demo to open a demo file in which the Events last for multiple days or even years, instead of just minutes and seconds
▪Click Analysis - Evaluation - Timeline Chart ![]() for a graphical representation.
for a graphical representation.
▪For details on the appearing Timeline Chart, read the Timeline Chart section.