IMPORTANT: The statistics, exports and analysis routines available within the Timeline Chart, always reflect the data currently visible in the Timeline Chart.
If e.g. you are ‘zoomed-in' on just a part of your data, only this part is taken into account in the statistics results.
This statistical overview offers you a DataSet-based view of various statistic values at once. You can select the required values in the Application settings.
▪Select Analysis - Evaluation - Statistics ![]() >Statistics per Code (report) from the main menu
>Statistics per Code (report) from the main menu
OR
▪Within the Timeline Chart window, click ![]() or choose Statistics per Code (report) from the Analysis menu or click
or choose Statistics per Code (report) from the Analysis menu or click ![]() .
.
INTERACT now automatically calculates various statistic figures and display the results in the DataSet statistics window like this:
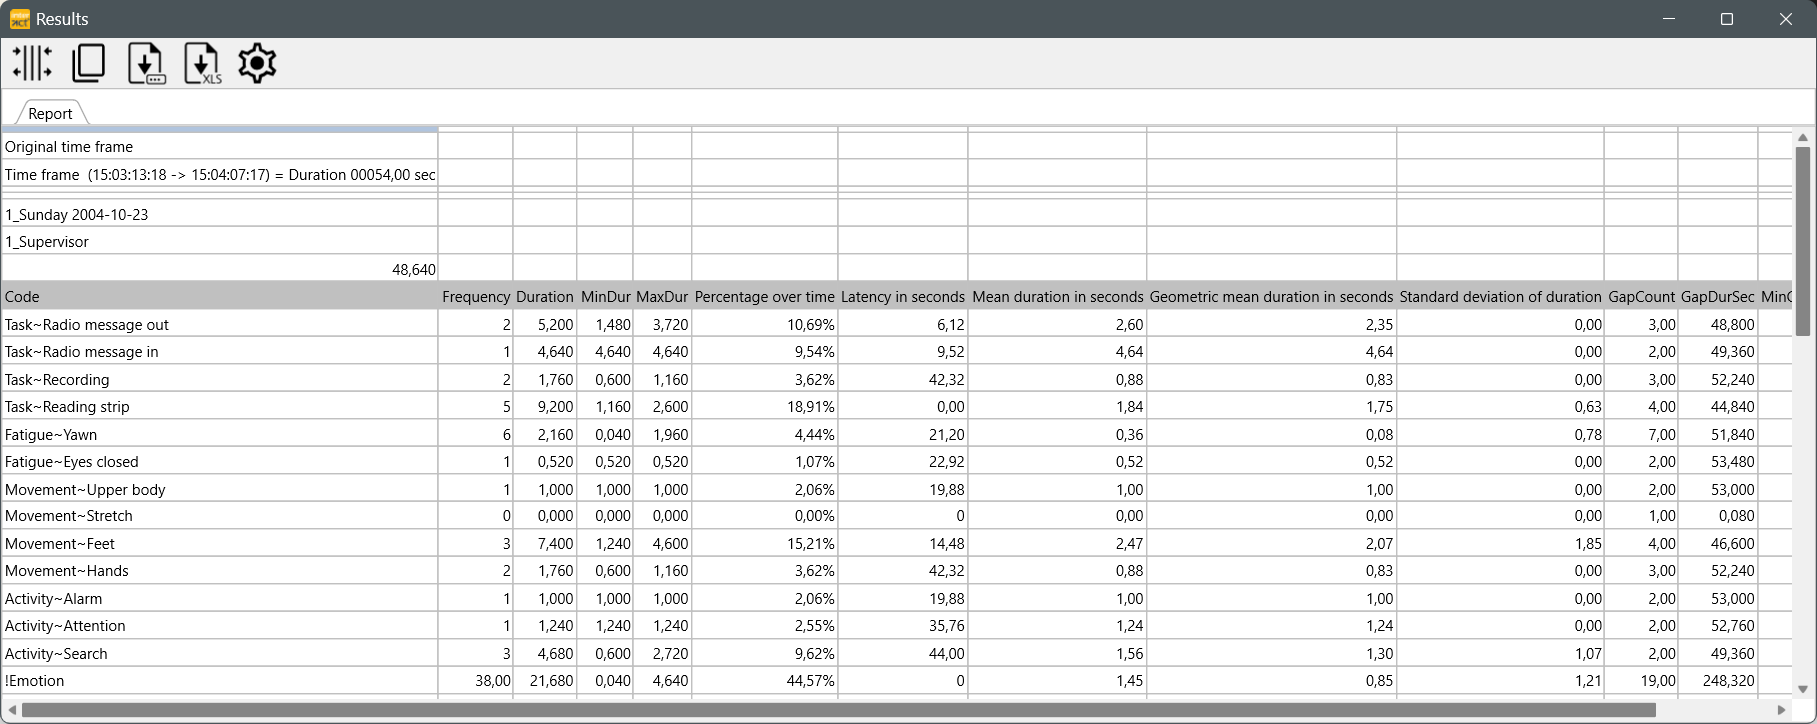
| TIP: | Click the Optimal Width |
Each Group and Set is identified by either the original Set and Group number or the description you entered into the description field of your Sets and Groups (as is described in Identify DataSets and Groups).
(In this Airtraffic Controller example, which is available among the Demo files, the DataSet description is "Supervisor", "Controller Edgar" and "Controller Mulder" and the Group description is "Sunday 2004-10-23".)
Available Values
As stated before, you can select the required statistical figures in the Application Setting on the tab Behavior - Statistics.
An overview of all available statistical figure types can be found in Column declaration.
Order of Codes and Classes
The order of the listed Codes, is determined by their order in the assigned Code Archive.
To correctly compare multiple documents that belong to the same study, ensure that they are assigned to the same Code Archive!
Per default INTERACT displays only Codes from the current data file.
If you want to see all Codes that are available within the current Code Archive, you need to change the appropriate setting, as described in the Timeline Chart options - Statistics.
| TIP: | To influence the order of the Codes and Classes in the statistics, read the topic Sort Code Archive contents. |
As usual, the Result table holds the following commands:
oSummary command to summarized the values over all displayed Sets.
oCommands to Save and Copy the results as shown.
oExport command to create an Excel file from the shown results.
oSettings to alter the time format displayed in the results.
Note: The order of the codes is determined by the current code archive. Therefore, it is important that you always use a project- or study-specific code archive.
How to change the order is explained in Sort code archive.