If you create or open a document, the corresponding Document Pane will display its contents in a single tab inside the application windows.
Multiple documents mean multiple document tabs.
Document Structure
The display of each document resembles a spread sheet: all Observation Codes and corresponding time values are structured in columns and lines, each column name represents a behavioral 'Class' of your coding system.
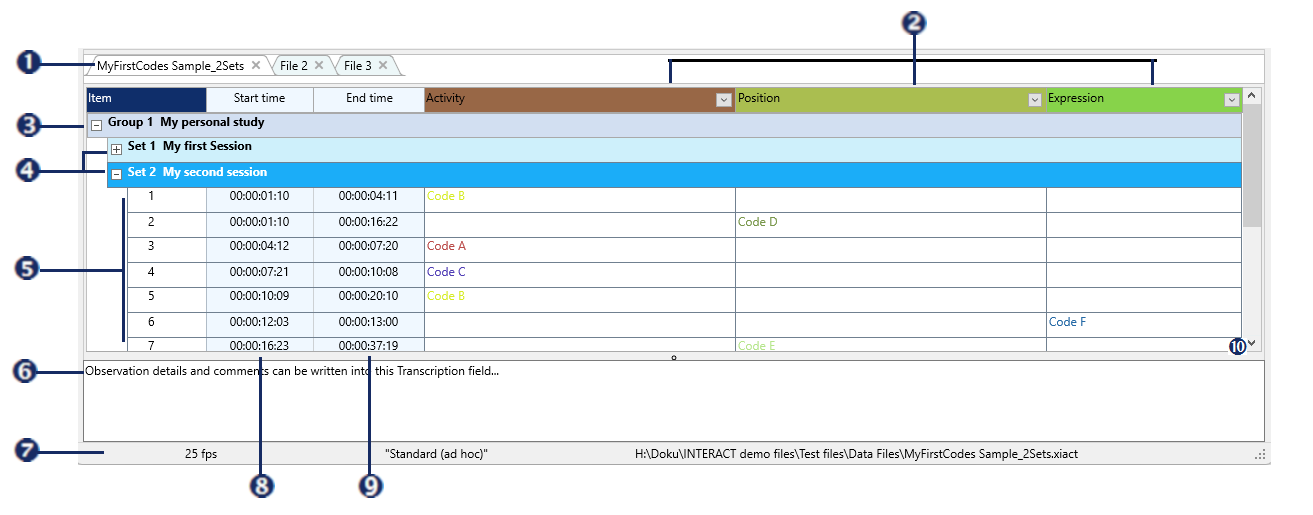
Window Elements
|
Tabs - Each opened INTERACT data file is represented by a tab. |
|
Class names - Displayed as column headers. |
|
DataGroup - Element to group your observations. |
|
DataSet - Element representing your observational session, grouping the logged Events. |
|
Events - Lines with start time and Offset time information and behavioral Codes. |
|
Transcript area - Field for free text entries, available per selected line. The position can be changed in the Main Layout settings. |
|
Status bar - Shows general information about the frame rate, active coding mode and selected line information. |
|
start time - Start time of a DataGroup, a DataSet or an Event |
|
Offset - End time of a DataGroup, a DataSet or an Event |
|
Scroll-Bars Horizontal & Vertical - Whenever columns or rows can no longer be displayed, due to a lack of space, the corresponding scroll-bar appears: Horizontal to scroll through columns, vertical to scroll through lines. |
All time-information, as well as behavioral data, is collected in Events.
Behavioral data is identified by Codes, spread over multiple Classes, displayed as columns.
Structural line-elements, like DataGroup and DataSet, are used to group Events.
Typically, a DataSet is created per test situation. Using a DataSet per subject within the same session can be useful too - depending on what you want to compare during analysis.
Note: Data Evaluation routines like finding Co-occurrences, Sequences and Contingencies are only examining/comparing data within the same DataSet.
For easy identification, enter a descriptive name for each DataSet and each DataGroup.
| TIP: | You can collect multiple sessions within one data file. Store the information in separate DataSets and/or DataGroups, to keep them apart. Multiple raters should work in separate documents - you can merge your documents later on. |
Collapse and Expand Elements
In addition to the toolbar commands, each document pane offers a few display functions for that specific document.
Per element
|
Fold this Element - Collapses all DataSets, so none of the available Events are visible |
|
Unfold this Element - Expands all DataSets, so all Events are visible |
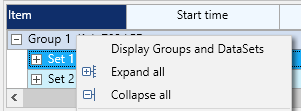
Per Document To collapse or expand all elements in the document at once: ▪Right-Click into the document and select Expand all or Collapse all from the context menu. |
|
Column Width
You can adjust the width of a specific column manually, by dragging one of the boders.
Note: If all class-columns are currently displayed in their 'perfect fit' for the current document-width, adjusting one column automatically changes the width of the neighboring column.
On the View tab you find a command to automatically adjust all columns at once:
![]() Optimal Width - Toggles the column width between:
Optimal Width - Toggles the column width between:
oPerfect fit for all columns inside the document pane
oOptimal width per Class name
oOptimal width to display containing Codes per column
Most structural elements have their fixed position, still it is possible to adjust the layout of your main screen in various ways:
▪Click View - Document - Main Layout ![]() to open the settings dialog:
to open the settings dialog:
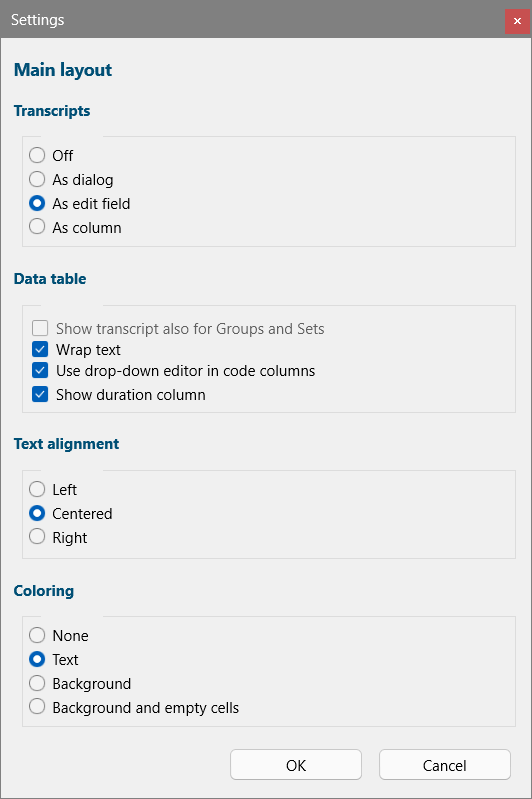
Text Alignment
Select the way you want your Codes to align in your Class columns:
oLeft - All Codes are aligned to the left side of their cells
oCentered- All Codes are aligned in the middle of their cells
oRight - All Codes are aligned to the right side of their cells
Note: Center alignment does NOT work when the option Wrap text is active.
Show Transcript
Per default, the Transcription field is located at the bottom of the INTERACT window. As of version 20 it is possible to select another position for this field:
oOff - No Transcript field is visible
oAs dialog - the Transcript field becomes a floating text field that can be positioned anywhere on the screen.
oAs edit field - Default position at the bottom of the INTERACT window.
oAs a column - Displays the transcriptions as a column in front of the Class columns.
oShow Transcript also for Groups and Sets - Only available in combination with the As a column option for transcripts. Per default, these Group and Set transcripts are hidden because they contain video links and Independent Variable information.
Data Table
oWrap text - Activates automatically adjusted row-heights, allowing you to display large text-blocks within a cell.
oUse drop-down editor in code-columns - Special feature for explorative coding that lists all entries found for that column in a drop down list to choose from. Also useful for making corrections to existing data. See Explorative Data Collection example.
oShow duration column - Adds a column showing the duration for each line.
Coloring
These settings allow you to display your Codes and their Class column headers in the colors as specified in the Code Archive:
oNone - No coloring. Column headers are dark blue and all Code-text is Black.
oText - The Codes themselves are displayed in their assigned colors.
oBackground - The Background of cells containing a Code are filled with their assigned colors.
oBackground and empty cells - Additionally, all empty cells are filled with the color of the Class itself.